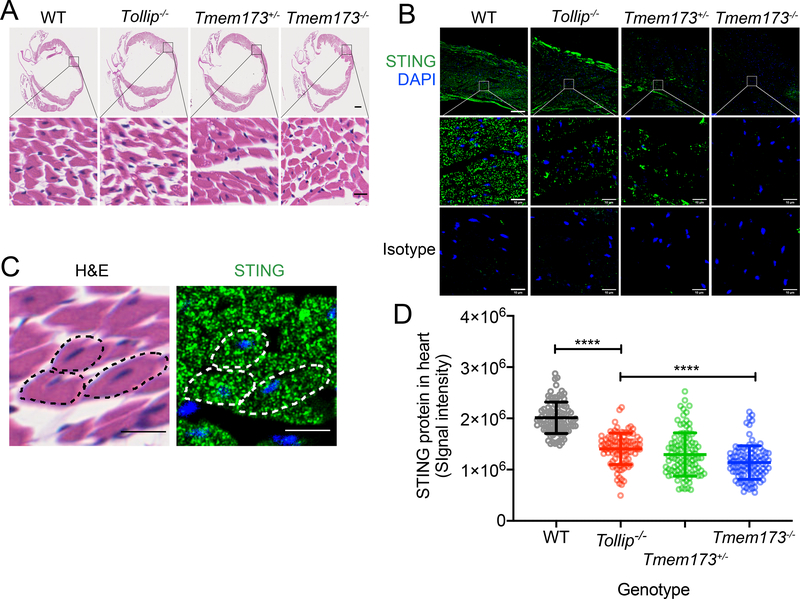
Figure 8. STING protein level is reduced in Tollip−/− mouse heart tissue.
(A) H&E staining of fixed mouse heart from indicated genotypes (top). Top images showing the whole heart and bottom images showing enlarged view of cardiomyocytes. Scale bars, 500 μm (upper panels) and 10 μm (lower panels).
(B) Fluorescent immunohistochemistry staining with anti-STING (top, and enlarged view at the middle) or Isotype antibody (bottom). STING in green and DAPI in blue. Scale bars, 60 μm (upper panels) and 10 μm (middle and lower panels).
(C) A representative enlarged view of cardiomyocytes in wild type heart stained for H&E (left) anti-STING (right) using adjacent tissue slides cut from the same paraffin-embedded block. Dotted lines indicate the same three cardiomyocytes from both images. Scale bars, 10 μm (both panels).
(D) Quantification of STING protein fluorescent intensity from B. Four separate areas were chosen from each heart and 25 region-of-interests (ROIs) were randomly chosen from each area (see Supplementary Figure 3). STING fluorescent signal intensity from 100 ROIs are showing for each genotype. ****, P < 0.001. Error bars represent the SEM. Unpaired Student’s t test (2-sided).
Experiments were repeated three times using different mouse of each genotype.

