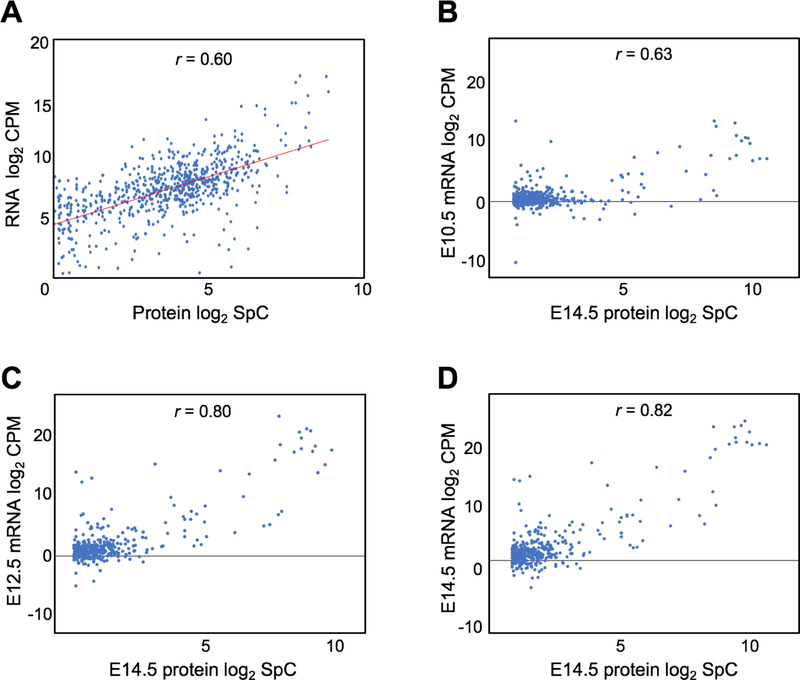
Fig. 8. Comparison of mouse lens proteome with the transcriptome.
(A) Correlation analysis of 1417 genes common to mouse E14.5 lens proteome and mouse E14.5 lens RNA-seq data with significant expression cutoff of spectral count ≥2.0 (for protein data) and ≥2.0 counts-per-million (for RNA data). The mRNA-protein correlation was analyzed with Pearson’s correlation coefficient (r) which indicated an overall positive correlation between the transcriptome and the proteome (r = 0.6). The x-axis represents log2 protein SpC and the y-axis represents the log2 mRNA counts. (B-D) Correlation between 422 lens-enriched proteins and their corresponding mRNA at E10.5, E12.5 and E14.5 as analyzed by Pearson’s correlation coefficient method. The mRNA-protein correlation is higher in lens enriched proteins compared to lens expressed proteins and increased with progressive development of the lens through stages E10.5 (r =0.63), E12.5 (r =0.80) and E14.5 (r =0.82).

