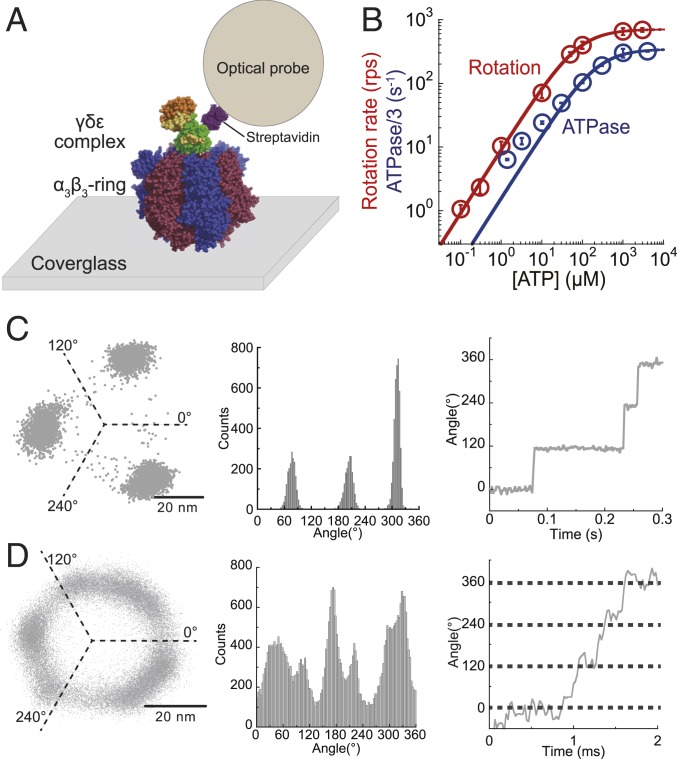
Fig. 2.
ATP-driven rotation of bMF1. (A) A schematic image of the single-molecule rotation assay of bMF1. The α3β3-ring is immobilized on a glass surface, and a detection probe is attached to the γ subunit via biotin–streptavidin interaction. (B) [ATP] versus the rate of rotation (red) or ATPase/3 (blue). The mean value and the SD for each data point are shown with circles and error bars, respectively (n = 20 to 25 for measurement of rotation rate, n = 3 for measurement of ATPase). Solid lines represent Michaelis–Menten fittings; Vmax: 707 ± 5 rps, Km: 77 ± 2 μM for rotation rate; : 346 ± 11 s−1, : 218 ± 26 μM for ATPase/3 (fitted parameter ± fitting error). (C and D) x–y plot, angular histogram, and time course of rotation found at 300 nM ATP (C) and at 3 mM ATP (D). The recording rate was 500 and 45,000 fps, respectively.

