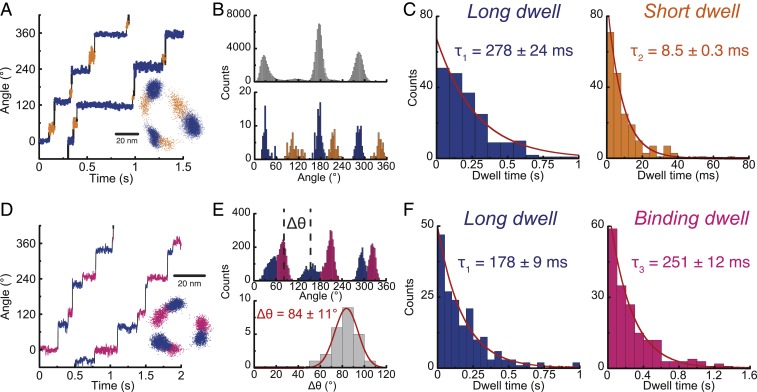
Fig. 4.
ATP-driven rotation of bMF1(βE188D). From Michaelis–Menten fitting, Vmax and Km were estimated to be 1.24 ± 0.03 rps and 1.15 ± 0.13 μM (fitted parameter ± fitting error), respectively (SI Appendix, Fig. S3B). (A) Time course of rotation at 1 mM ATP recorded at 2,000 fps. CP analysis detects long (blue) and short (orange) dwell. (Inset) x–y plot. (B) Histograms for dwell position analysis. (Upper) The conventional histogram of angle positions from all data points from the time course. (Lower) The histogram of angle positions of dwells detected by CP analysis. (C) Dwell-time analysis of long and short dwells at 1 mM (n = 5). Values are fitted parameter ± fitting error. (D) Time course of rotation at 1 μM ATP recorded at 500 fps. (Inset) x–y plot. (E) Histograms of angle positions. (Upper) The conventional histogram from all data points. (Lower) The histogram of the angle positions of long dwell from binding dwell (Δθ), defined in the upper panel. Values are mean ± SD (n = 24, 8 molecules). (F) Dwell time analysis of long and binding dwell at 1 μM (n = 5). Values are fitted parameter ± fitting error.

