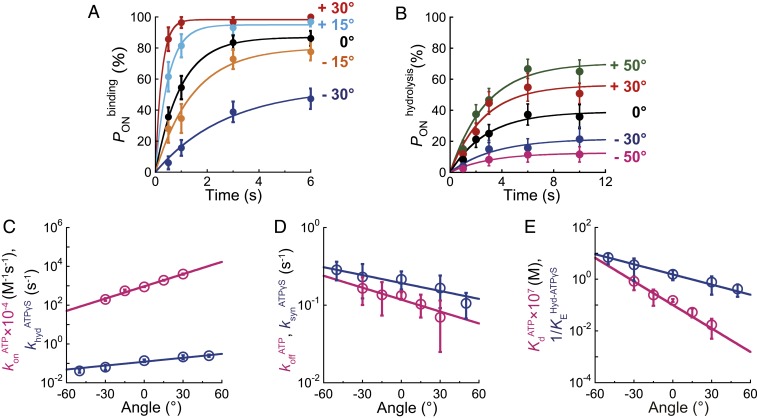
Fig. 6.
Angle dependence of ATP binding and ATP hydrolysis in bMF1. (A) Time course of at 100 nM ATP in bMF1(WT). Each data point was obtained from 21 to 67 trials using 5 to 13 molecules. (B) Time course of at 1 mM ATPγS in bMF1(βE188D). Each data point was obtained from 28 to 64 trials using 3 to 8 molecules. (C–E) Angle dependence of ATP binding and ATP hydrolysis. 0° represents the initial position of ATP binding or hydrolysis before manipulation. The directions for “forward” and “reverse” reactions are defined as that for ATP hydrolysis (counterclockwise) and ATP synthesis (clockwise), respectively. Pink and blue represent ATP binding/ATP release and ATP hydrolysis/ATP synthesis. (C) Modulation of forward reactions upon rotation ( in pink and in blue). (D) Modulation of reverse reactions upon rotation ( in red and in blue). (E) Modulation of equilibrium constants upon rotation ( in pink and in blue). The circles and error bars in each data point represent the fitted parameter and fitting error determined in A and B.

