Fig. 2.
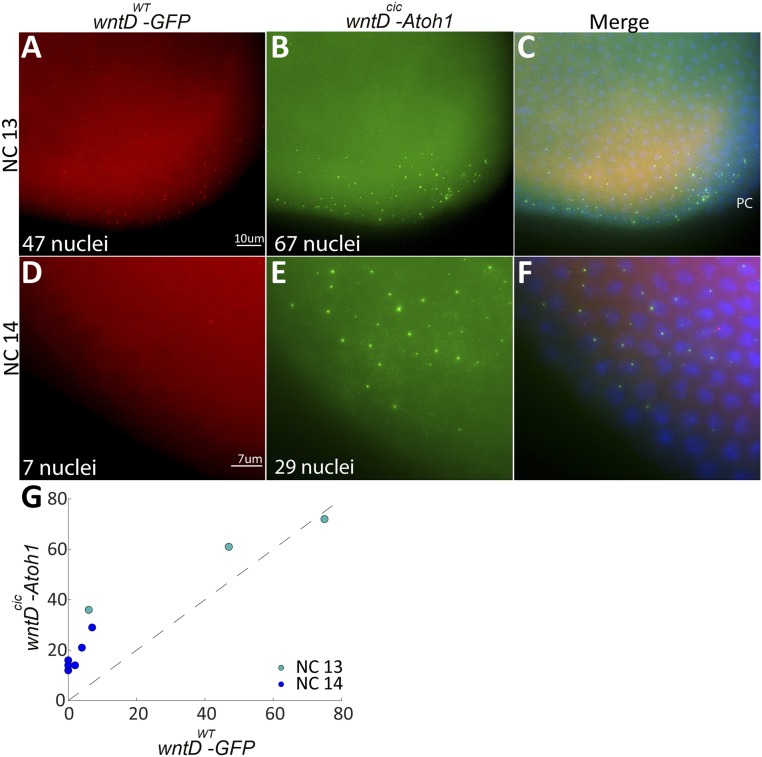
Modulation of a Cic-binding site expands wntD expression. Modeling suggested that alteration of a Cic-binding site would expand wntD expression. smFISH was used to follow active reporter transcription and compare the expression domains of the wild-type wntD enhancer (wntDWT) driving GFP expression (A and D, red) and a modified wntDcic enhancer driving mouse Atoh1 (B and E, green) within staged single embryos. (C and F) The merged images, along with DAPI staining (blue) to visualize the nuclei. PC, pole cells. (A–C) At NC 13, both constructs are expressed at the posterior pole of the embryo, but expression of Atoh1 via wntDcic is broader and encompasses more nuclei. (D–F) By NC 14, expression of GFP via wntDwt is almost diminished, indicating that steady state has been reached, while wntDcic still drives Atoh1 expression in a significant number of nuclei. (G) Compilation of data from multiple embryos shows that the number of nuclei expressing the wntDcic-Atoh1 construct is always higher. Each point on the plot represents an embryo fixed at a specific time point in the embryo. The x axis represents the number of wntD-expressing nuclei via the wild-type enhancer while the y axis represents the number of wntD-expressing nuclei via the mutant enhancer. The dashed line is the x = y boundary; therefore, for points above the dashed line, the number of expressing nuclei is greater for the mutant enhancer and vice versa. Two trends are observed: 1) All but one dot are well above the dashed line, indicating a greater amount of expressing nuclei for the mutant enhancer throughout NCs 13 and 14, and 2) The dark blue points depicting NC 14 all show a smaller number of expressing nuclei than the green points displaying NC 13, indicating a decrease in the amount of expressing nuclei between NCs 13 and 14 for both WT and mutant enhancers.

