Fig. 3.
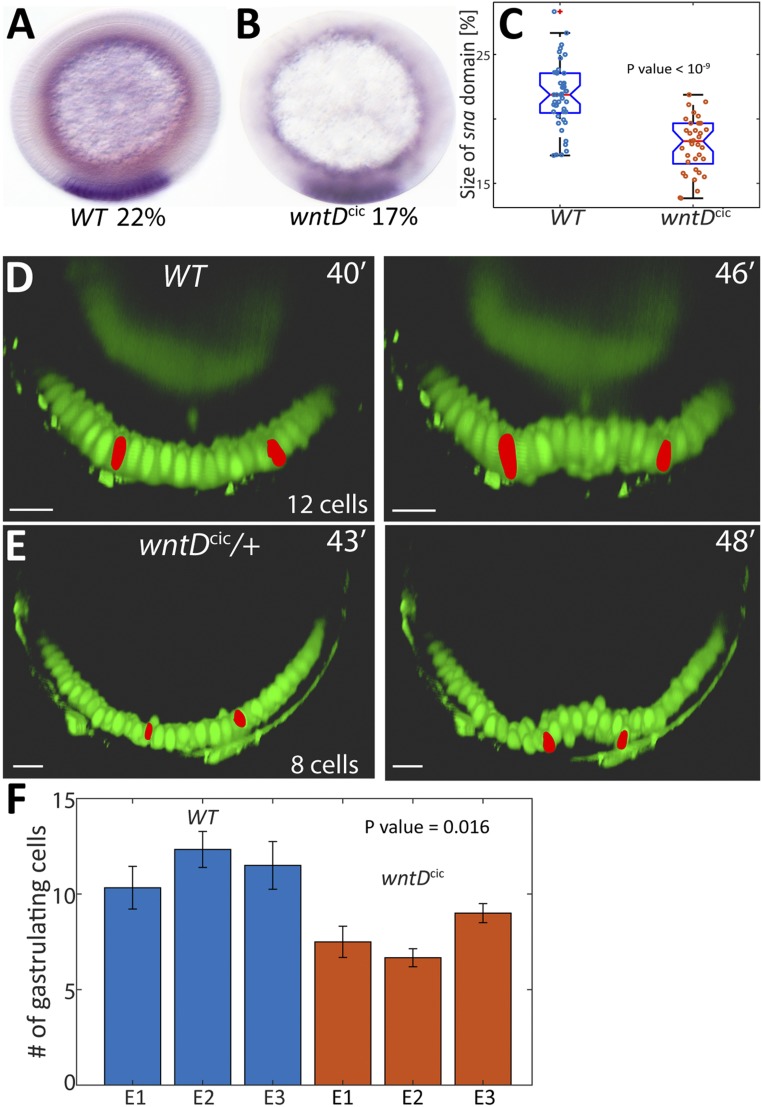
Expanded wntD expression alters the global Toll activation profile. (A and B) The circumferential proportion of the domain expressing sna (purple ventral stripe) was monitored as a measure for the width of the Toll pathway activation profile. (C) The size of the sna domain, measured in multiple embryos, was consistently higher in wt embryos than in wntDcic embryos. Box plots of percent of sna domain sizes: Boxed area defines 25 to 75 percentile and the whiskers extend to the most extreme points not considered outliers. Mean is marked by red line. Note that at NC 14, when prominent sna expression is induced, expression of wntDcic did not reach termination and steady state (Fig. 2E). Thus, monitoring sna expression is an under-estimate of the capacity of excess WntD levels to influence and restrict Toll pathway activation under these conditions. (D and E) Analysis and comparison of the number of cells undergoing ventral furrowing, monitored by live imaging of Dorsal-GFP (green), which localizes to ventral nuclei, in wt and wntDcic/+ embryos. Nuclei at the lateral edges of the ventral furrow (red) served as guideposts for the extent of the gastrulating domain. (F) Quantitation of 3 embryos of each genotype demonstrates that the size of the invagination domain is consistently smaller in wntDcic/+ embryos (P value indicated on plots C and F was calculated using unpaired t test). Error bars reflect differences in measurement between 3 anterior-posterior locations within each embryo. (Scale bars, 20 μm.)

