Fig. 2.
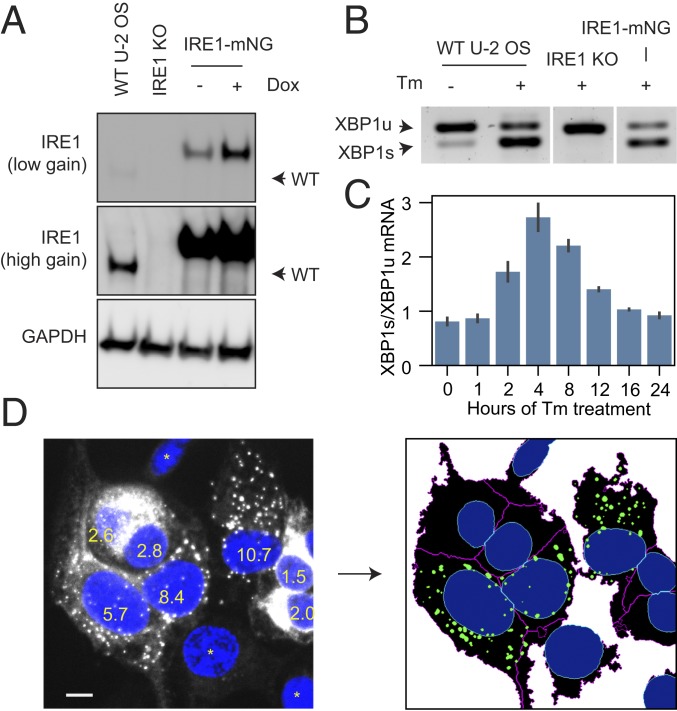
Reconstitution and quantification of IRE1 clustering. (A) Immunoblot against IRE1α in parental U-2 OS Flp-In T-Rex cells, IRE1αKO cells, and IRE1-mNG cells expressing IRE1-mNG under a doxycycline-inducible promoter. (B) Stress-dependent splicing of XBP1 mRNA in parental, IRE1αKO, and IRE1-mNG cells treated with 5 μg/mL Tm for 2 h where indicated, assessed by RT-PCR. (C) Quantification of the ratio of the XBP1s over XBP1u mRNA in IRE1-mNG cells over a 24-h stress time course, assessed by densitometry of RT-PCR gels (3 replicates, error bars represent SD) (D) Automated detection of IRE1 clustering in microscopy images. Average intensity projections of a confocal z-stack of IRE1-mNG cells with DAPI-stained nuclei (Left) are filtered, thresholded, and segmented, as described in the text to produce ER, nuclear, and cluster masks (Right). Granularity scores with a 1-μm structuring element are superimposed on the nuclei. Asterisks denote cells with low IRE1 expression levels that do not meet the cluster detection threshold. In this dataset, the minimum granularity value that established clustering in the cell was 4.0. (Scale bar, 10 μm.)

