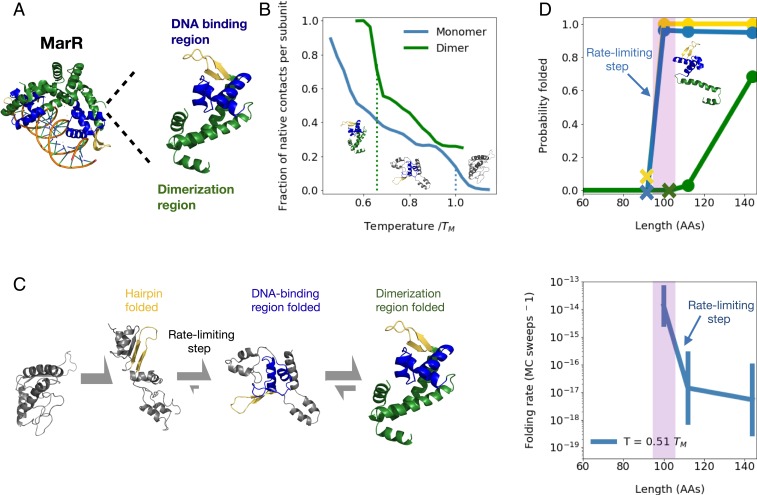
Fig. 2.
(A) Structure of native MarR dimer bound to DNA (Left) as well as monomer (Right) with highlighted dimerization region (green), DNA-binding region (blue), and a crucial beta hairpin involved in stabilizing the DNA-binding region (gold). (B) Mean fraction of native contacts per subunit for monomeric and dimeric MarR as a function of temperature normalized by DNA-binding region melting temperature (right dotted line). The dimer melting temperature is indicated by the left dotted line. Sample monomeric structures from each temperature range are shown, illustrating melting of the dimerization region followed by the DNA-binding region. (C) Predicted folding pathway of MarR monomer. (See text for details.) (D) (Top) At various chain lengths, we plot the equilibrium probability that the structural elements associated with each folding step in the MarR monomer folding pathway are folded (gold, hairpin folding; blue, DNA-binding region folding; green, dimerization region folding). Xs indicate the minimum chain lengths at which each step is possible. (Bottom) For each chain length shown in Top, we plot the rate of the slowest folding step–DNA-binding region formation. A narrow window of chain lengths that confers both folding speed and stability is highlighted in purple. Error bars on folding rates are obtained from bootstrapping (Materials and Methods). Both Top and Bottom are shown at a simulation temperature of .

