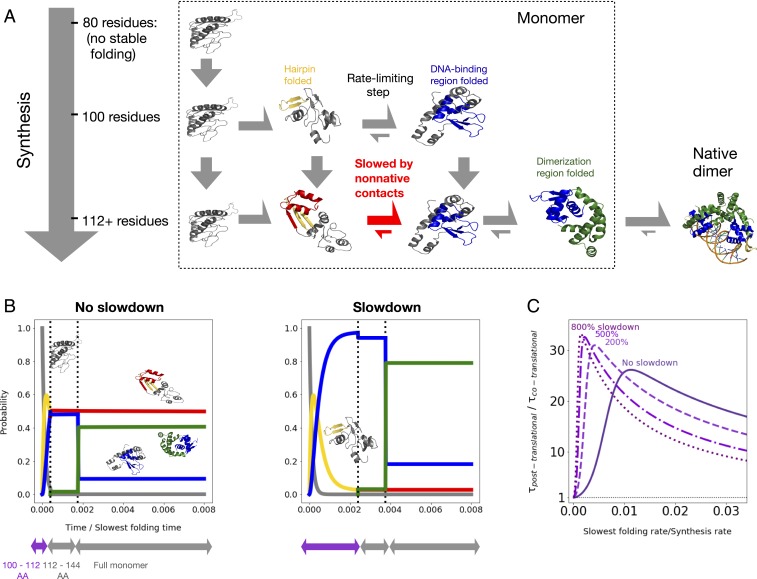
Fig. 4.
(A) Schematic of kinetic model (see main text and Materials and Methods for details). Dimerization is shown for completeness, but not accounted for in the kinetic model. (B) Time evolution for the probability of occupying different states as a function of time, assuming the slowest folding rate is times the protein synthesis rate (under constant translation speed). We further assume either no slowdown at conserved rare codons between residues 100 and 112 (Left) or a sixfold slowdown at rare codons (Right) (main text and Materials and Methods). States are colored as in A (black, no native tertiary structure; gold, beta hairpin folded; red, beta hairpin folded with significant nonnative contacts; blue, DNA-binding region folded; green, fully folded), and sample structures are shown. We neglect lengths prior to 100, at which point no folding occurs. (C) Fractional reduction in the mean time to complete synthesis and folding as a function of unknown synthesis rate, assuming various percent slowdowns at rare codons indicated by numbers over the curves.

