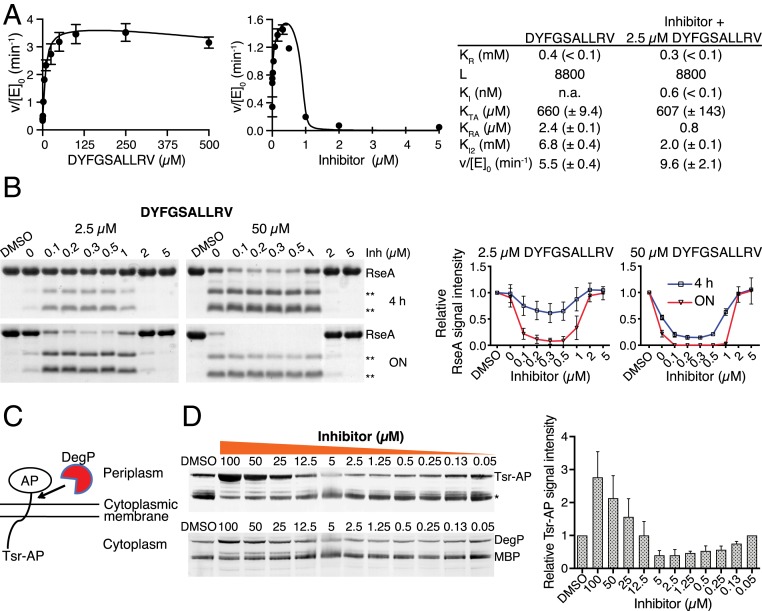
Fig. 2.
Activation of DegP by substoichiometric inhibition. (A) Activity of DegP (1 µM) using chromogenic SPMFKGV-pNA (500 µM) as a substrate in the presence of various (Left) or fixed (Right) concentrations of DYFGSALLRV (2.5 µM, corresponding to twofold Kd) and various concentrations of the inhibitor DPMFKLV-B(OH)2 (Inh). Error bars indicate SD of experimental data (n = 3). Data were fitted to the MWC model as described in SI Appendix. L, equilibrium constant between T and R conformations in the absence of ligand; KR, dissociation constant for substrate binding to activated DegP; Ki, affinity of the inhibitor to activated DegP; KTA and KRA, the dissociation constants for the interaction between the activator and the T state conformation and R state conformation, respectively; Ki2, affinity of the activator for the active site; v/[E]0, maximum turnover rate for the activated DegP species; parentheses, 95% confidence limit of the fit. (B) Representative images of the digestion of the periplasmic domain of RseA (20 µM) by DegP (1 µM) in the presence of fixed concentrations of DYFGSALLRV (2.5 and 50 µM) and concentrations of DPMFKLV-B(OH)2 indicated (Upper). **, RseA cleavage products. Quantification of DegP activity using the signal intensity of RseA relative to the DMSO control (Lower). Error bars indicate SD (n = 3). (C) DegP activity in vivo. Cartoon of cell-based DegP reporter assay. Alkaline phosphatase (AP) is tethered to the N-terminal 164 amino acids of the Tsr protein. DegP cleaves the Tsr-AP hybrid protein near the fusion joint. (D) Inhibitor-mediated activation of DegP activity in vivo. E. coli cells expressing the tsr-phoA fusion were grown overnight (ON) at 30 °C in rich medium with either DMSO (2%) or various concentrations of DPMFKLV-B(OH)2. Whole-cell extracts of equivalent numbers of cells were subjected to SDS/PAGE and Western blotting using antibodies against AP. *, Tsr-AP degradation products. Additional Western blots of the same samples using MBP-DegP antibodies (Lower). Quantification of DegP activity using the signal intensity of the Tsr-AP band relative to the DMSO control (Upper). Error bars indicate SD (n = 3).

