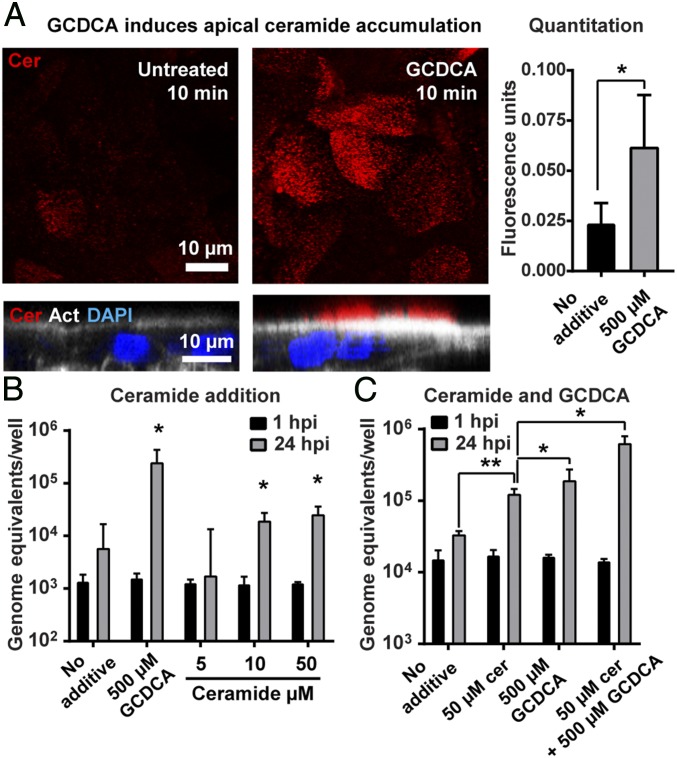
Fig. 6.
Ceramide enhances GII.3 replication. (A) Ceramide levels in HIE monolayers treated with GCDCA were analyzed by IF microscopy (Left). The Upper panels show ceramide staining (red) in optical slices at the apical surface of monolayers in the XY plane, while the Lower panels show orthogonal views. The orthogonal view shows the actin network at the base of the microvilli on the brush border (white, phalloidin) and nuclei (blue, DAPI). (Scale bars, 10 μm.) (Right) Quantification of the fluorescence intensity as described in Materials and Methods. (B and C) The HIE monolayers were infected with GII.3 as in Fig. 1 for 24 h with the indicated additives. Viral GEs at 1 and 24 hpi were quantified by RT-qPCR. (B) *P < 0.05 comparing GEs at 24 hpi to 1 hpi. (C) *P < 0.05 and **P < 0.01 comparing GEs of each sample at 24 hpi.

