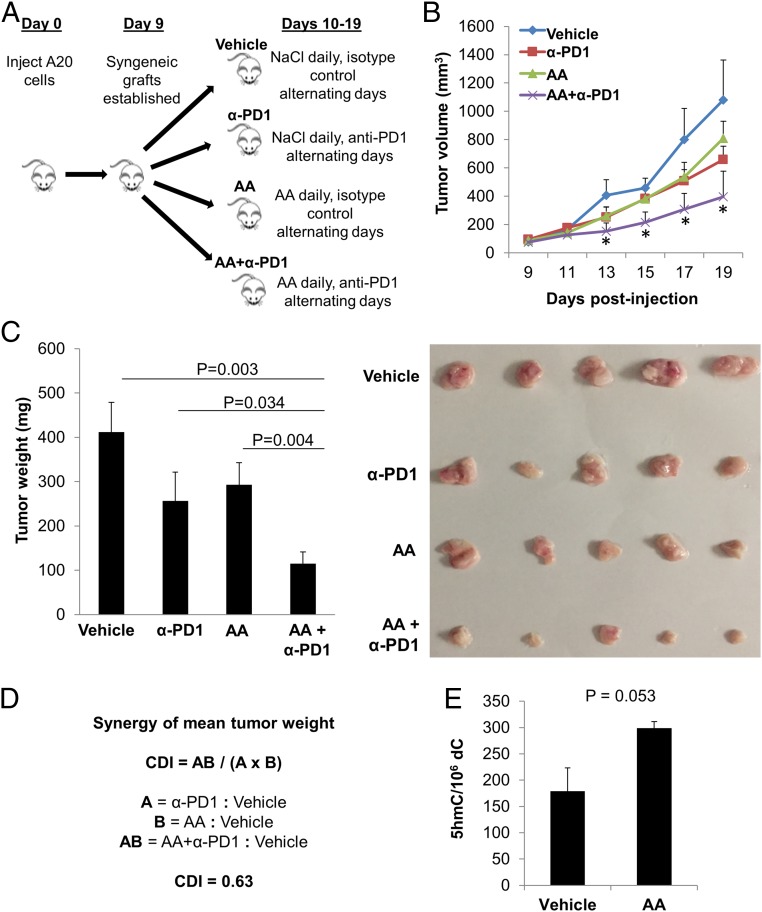
Fig. 3.
High-dose AA treatment synergizes with anti-PD1 checkpoint inhibition in a syngeneic lymphoma mouse model. (A) Forty BALB/c mice received an s.c. right flank injection of 5 × 10⁶ A20 tumor cells in PBS and were randomly assigned to 4 groups of 10 mice: vehicle, anti-PD1 (α-PD1), AA, or AA+α-PD1. On day 9, palpable tumors were observed in 7 to 9 mice in each group (vehicle, n = 7; α-PD1, n = 9; AA, n = 9; AA+α-PD1, n = 8). Daily treatment was administered from day 10 until the tumor size endpoint was met. (B) Tumor volume (cubic millimeters) was monitored every 2 d over the duration of the study by caliper and calculated as (Width2 × Length)/2, where W and L represent the shorter and longer diameters (millimeters), respectively. See all individual tumor growth curves in SI Appendix, Fig. S3. Given the highly aggressive nature of the A20 lymphoma mouse model, humane endpoint was reached in one mouse in the vehicle group on day 19 (after only 9 d of treatment). To facilitate comparison between the treatment groups, all mice in the 4 groups were killed on day 19 and tumors excised and weighed. The growth curve of the AA+α-PD1 group was significantly divergent from that of the vehicle group starting on day 13 (day 4 of treatment) and continuing through the end of the study (t test P values between AA+α-PD1 and vehicle groups on days 13, 15, 17, and 19 were 0.042, 0.016, 0.029, and 0.028 respectively; asterisk represents <0.05). On the other hand, the growth curves of neither single-agent α-PD1 nor single-agent AA were significantly divergent (statistically) compared to that of the vehicle group at any point, but both demonstrated a trend toward proliferation inhibition compared to the vehicle group. Single-agent α-PD1 vs. vehicle approached statistical significance with a P value of 0.069 at the end of the study on day 19. (C) Tumor weight was significantly lower in the combined treatment group, AA+α-PD1, compared to vehicle (P = 0.003), α-PD1 (P = 0.034), and AA (P = 0.004) groups (ANOVA, P = 0.025). Included in C is a representative picture of 5 tumors in each group, which were further studied for intratumoral epigenomic and immune microenvironment analyses. (D) CDI was calculated to test for synergy between AA and α-PD1 using mean tumor weight measurements. The CDI value of 0.63 indicates synergy (defined as CDI < 1, with CDI < 0.7 indicating a significantly synergistic effect). (E) Global 5hmC was elevated in tumors of mice treated with AA compared to vehicle (P = 0.053) as measured by MS. Data are expressed as means ± SEM.

