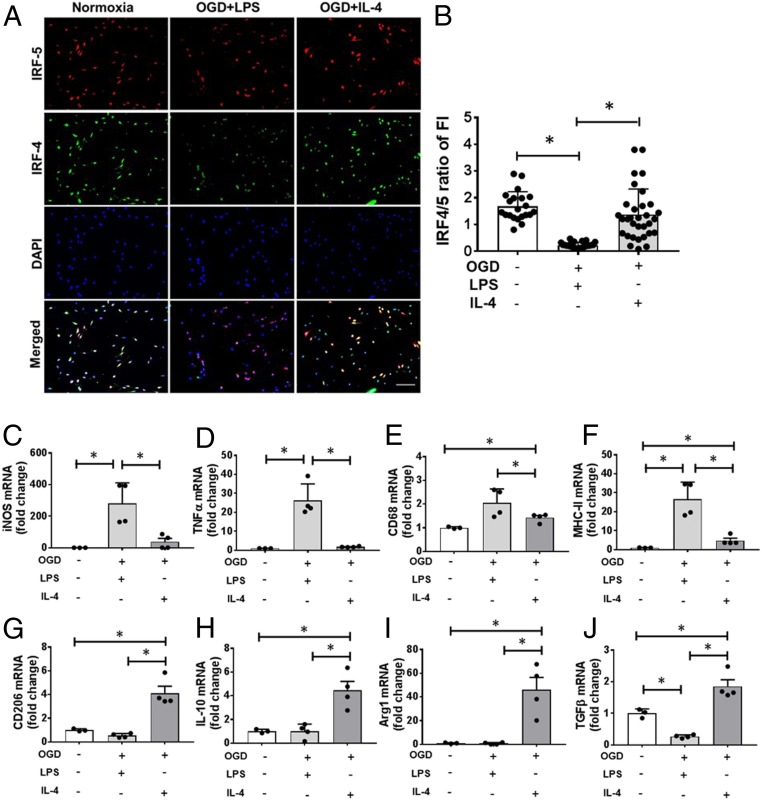
Fig. 1.
Microglial IRF5-IRF4 expression and phenotypes after OGD. (A) ICC of primary microglia exposed to OGD+LPS or +IL-4 stimulation showing IRF5 and IRF4 expression. 20×; (Scale bar, 100 μm.) (B) Ratio of IRF4 over IRF5 fluorescence intensity (FI). Data were averaged from 21 to 24 microscopic fields from 3 independent experiments; each dot represents the FI of one 20× microscopic field. *P < 0.05. (C–F) Proinflammatory mRNA levels by RT-PCR in cultured microglia. (G–J) Anti-inflammatory mRNA levels in microglia. Data were averaged from 3 to 4 independent experiments; each dot represents the mRNA level from one independent experiment. *P < 0.05.

