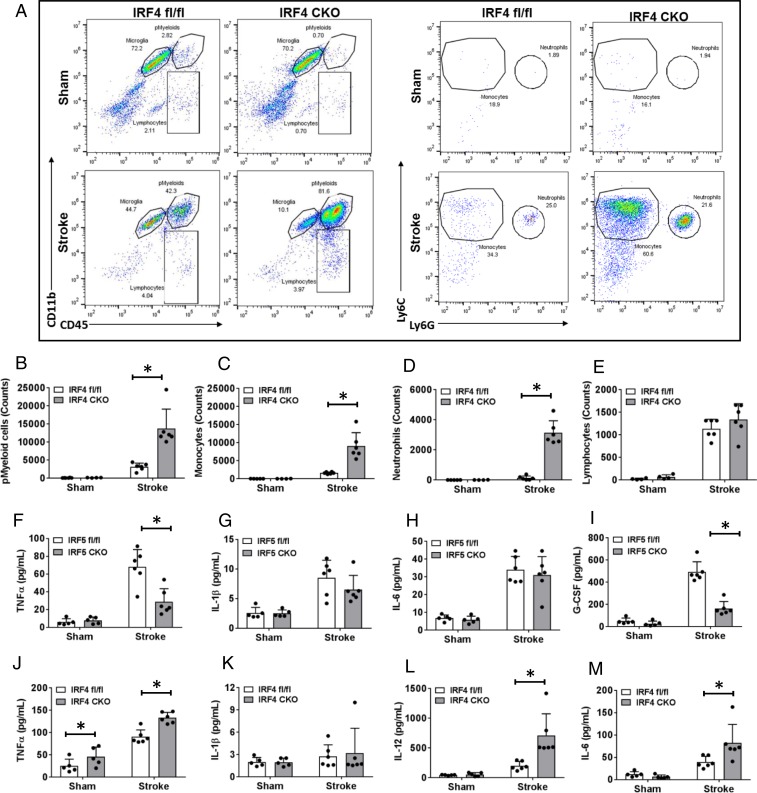
Fig. 5.
Brain infiltration of peripheral immune cells and circulating cytokine levels in IRF5 or IRF4 CKO mice. (A, Left) Flow plots: representative gating plots for total pMyeloid, microglia, and lymphocytes. (A, Right) Flow plots: gating strategy for monocytes and neutrophils. (B) Percentage of pMyeloid cells. (C–E) Absolute cell counts of monocytes (C), neutrophils (D), and lymphocytes (E). (F–M) Plasma levels of cytokines in IRF5 and IRF4 CKO mice, respectively. n = 5 to 6 per sham and 6 to 7 per stroke group; *P < 0.05.

