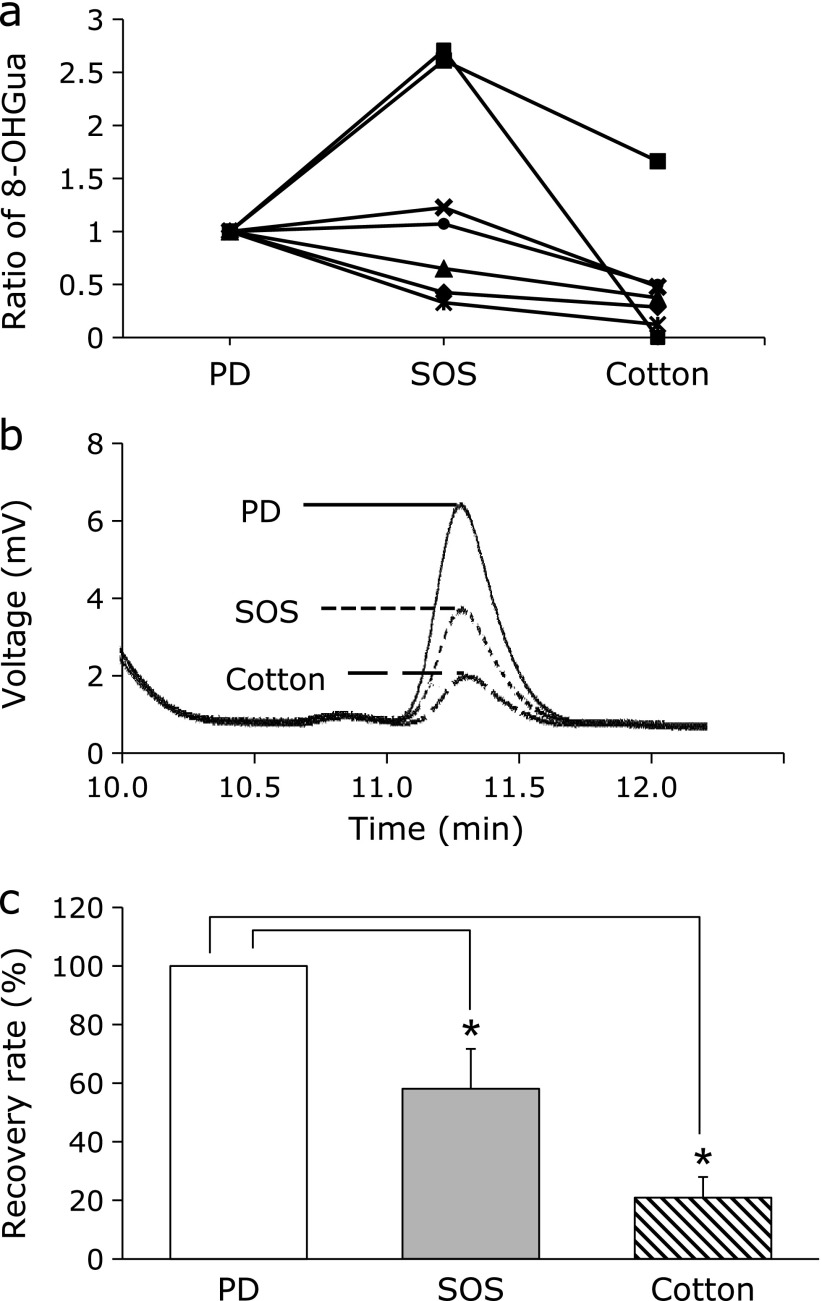
Fig. 2.
8-OHGua levels in saliva analyzed by HPLC-ECD. (a) The ratio of 8-OHGua measurement results (PD to collection material, SOS or cotton) for each subject (n = 7). (b) Typical HPLC-ECD chromatograms of the 8-OHGua in PD, SOS, and cotton samples. (c) Recovery rates of 8-OHGua in the PD, SOS, and cotton groups. Columns represent mean ± SE (n = 7). *p<0.05 (Wilcoxon signed-rank test).

