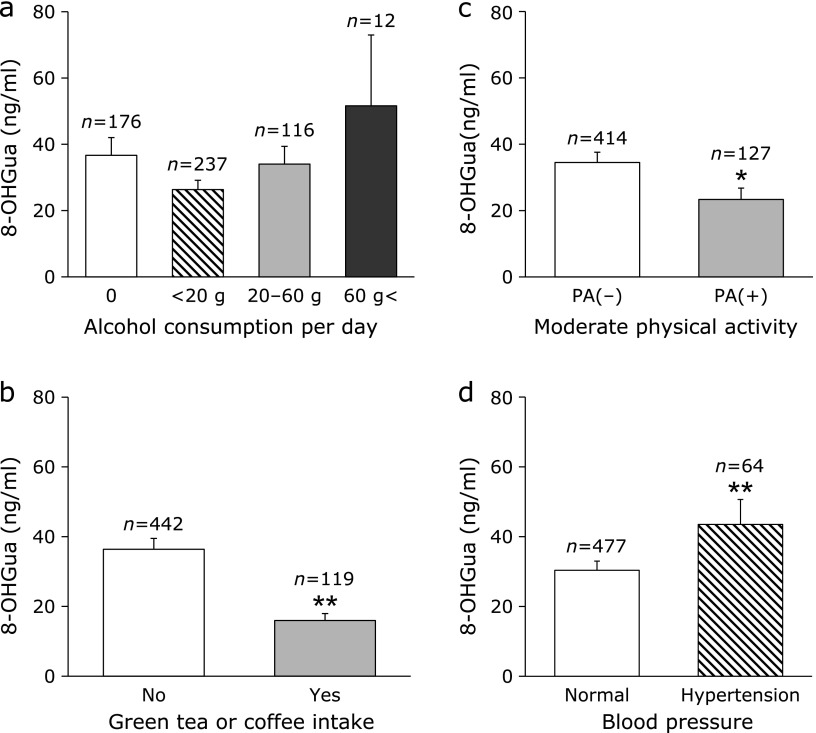
Fig. 5.
Lifestyle-related factors and salivary 8-OHGua levels. (a) Alcohol consumption and salivary 8-OHGua. (b) Salivary 8-OHGua level and green tea or coffee consumption (within 48 h before saliva collection). (c) Salivary 8-OHGua level and daily physical activity. “PA (–)” represents subjects that don’t perform physical activity, and “PA (+)” represents subjects that perform physical activity, like walking, on a daily basis. (d) Salivary 8-OHGua level and hypertension. Each column represents mean ± SE. *p<0.05, **p<0.01 [Mann–Whitney test for (b), (c), and (d)].

