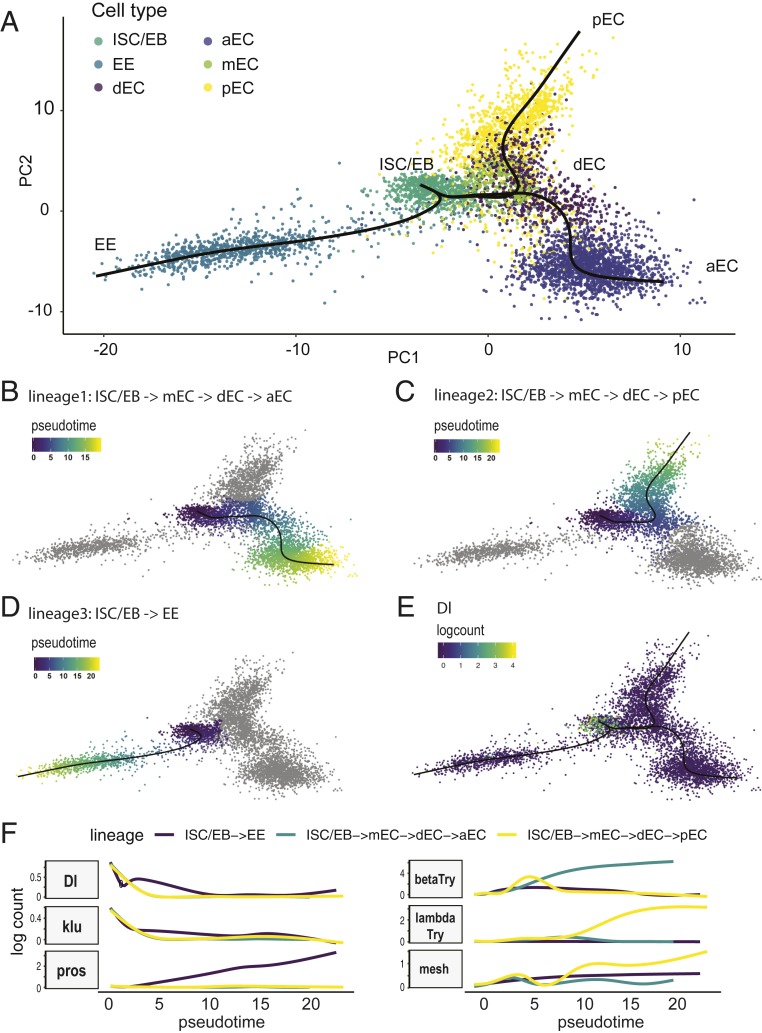
Fig. 3.
Results of cell lineage inference and pseudotime analysis using Slingshot. (A) Cell lineages were inferred using Slingshot. Three lineages were constructed: The first lineage is from ISC to aEC: ISC/EB → mEC → dEC → aEC (B). Pseudotime was inferred. The second lineage is from ISC to pEC: ISC/EB → mEC → dEC → pEC (C). The third lineage is from ISC to EE (D). (E) The expression level of Dl was plotted using logcount and its expression is restricted to the initial state (ISC/EB). (F) Plot of gene expression as a function of pseudotime for each lineage. The expression pattern of klu is similar to Dl (i.e., high in the beginning and gradually decreasing over pseudotime).

