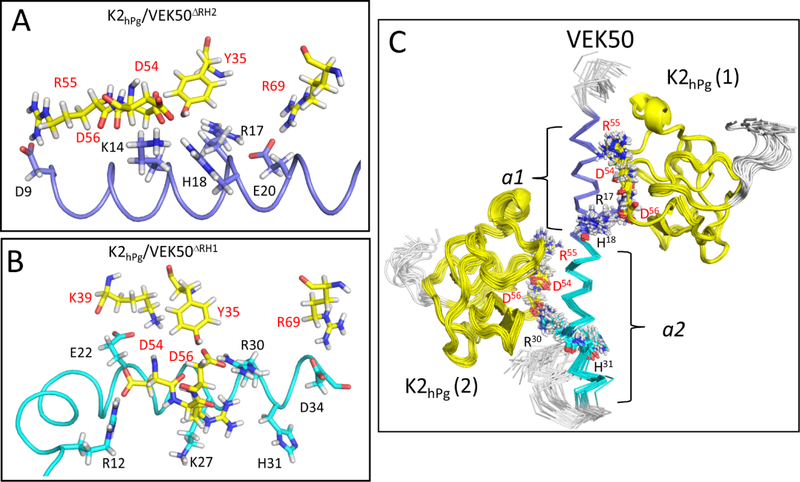
Fig. 6. Solution binding models of the K2hPg/VEK50 peptides derived from Xplor-NIH and HADDOCK.
The lowest-energy conformation was used for the representation of: (A) K2hPg /VEK50ΔRH2 and (B) K2hPg/VEK50ΔRH1. (C) Superposition of backbone traces of the 20 lowest-energy NMR structures of K2hPg /VEK50 is shown. VEK50ΔRH1 and VEK50ΔRH2 bind to K2hPg at a molar ratio of 1:1, whereas VEK50 binds to K2hPg at a molar ratio of 1:2. Residues having H-bond interactions with K2hPg and having close contact (~3 Å) are labeled and shown as sticks. K2hPg is colored yellow whereas the a1- and a2-repeats of VEK50 are colored magenta and cyan, respectively.

