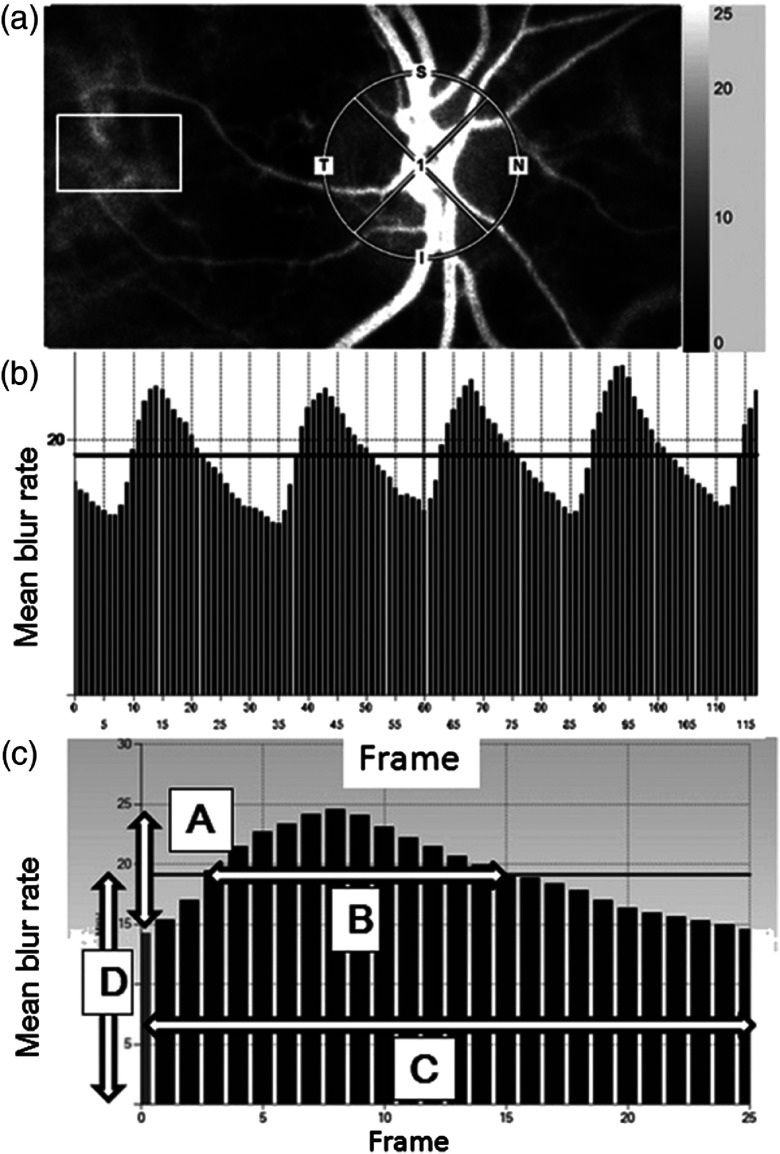
Fig. 7.
The method for analyzing the mean blur rate (MBR) using laser speckle flowgraphy. (a) The gray-scale map of the total measurement area. The circle and rectangle designate the area of the ONH and center placed at the tissue area avoiding the retinal vessel measured. (b) The pulse waves show changes in the MBR, which is tuned to the cardiac cycle for 4 s. The total number of frames is 118. (c) Normalization of one pulse. MBR values are provided on this screen. a, maximal MBR-minimal MBR; b, the number of frames spent at one-half value of A; c, the number of frames spent at one normalized pulse; d, the average MBR; T, temporal; N, nasal; S, superior; and I, inferior. Figure reprinted from Fig. 1 in Ref. 74, © 2019, with permission from Springer.

