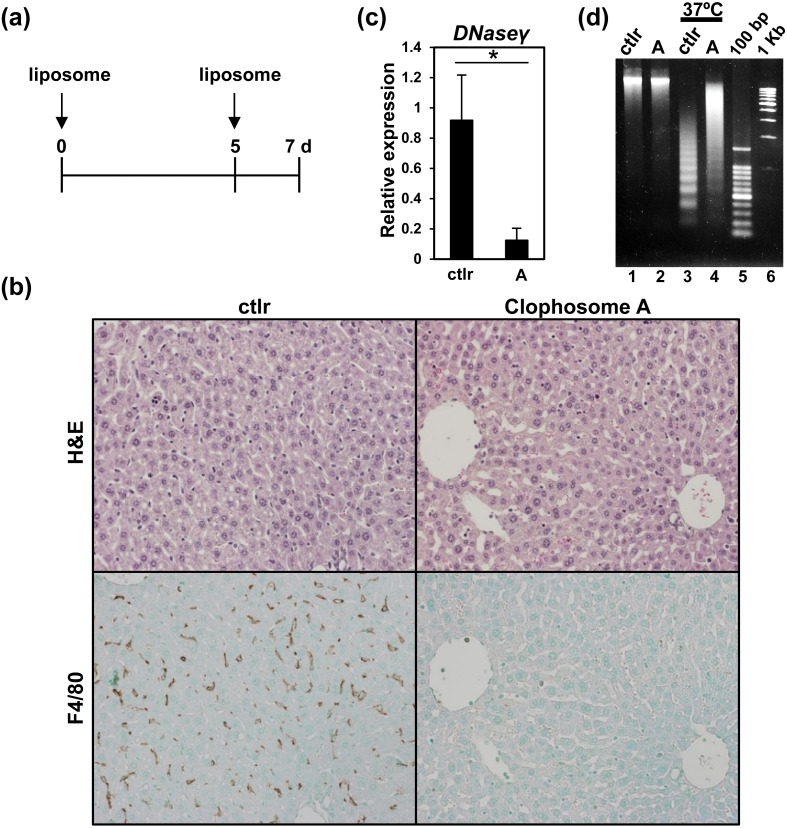
Fig. 2.
Kupffer cells produce DNase γ. (a) Time course of liposome treatments. C57BL/6 WT mice were injected with liposomes, Clophosome A or control-liposome, at day 0 and 5, and sacrificed at day 7. (b) H&E staining (top) and immunostaining (bottom) of mouse liver sections from the treated mice. Serial sections of a control-liposome treated mouse (ctlr) are shown in left panels and those of a Clophosome A-treated mouse in right panels. Kupffer cells were detected by immunostaining with anti-F4/80 antibody. (c) q-PCR analysis of DNase γ expression in a liposome-treated mouse liver. Relative expressions to Gapdh are shown. Left, control-liposome treated sample (ctlr); Right, Clophosome A-treated sample (A). Asterisk (*): P<0.01, n=4, Student’s t-test. (d) DNase γ activities in mouse liver. Control-liposome (ctlr, lanes 1 and 3) and Clophosome A-treated samples (A, lanes 2 and 4) are shown. Half of the samples were incubated at 37°C for 1 hr to determine DNase γ activities (lanes 3 and 4). Non-incubated samples were the control (lanes 1 and 2). 100 bp, 100 bp DNA marker. 1 kb, 1 kb DNA marker.

