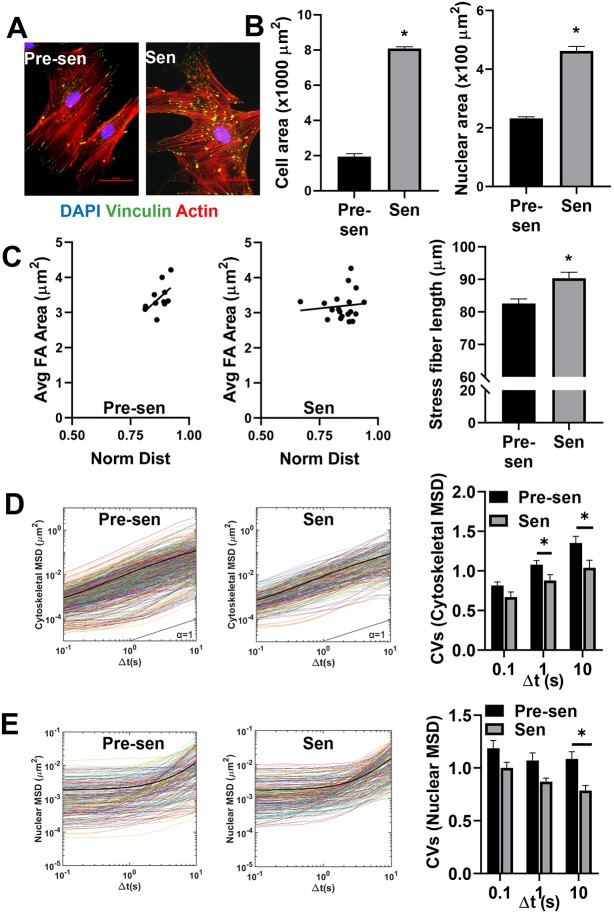
Fig. 1.
Senescent MSCs displayed altered, cytoskeletal and nuclear organization and mechanics. Human MSCs were treated with 15 Gy γ-irradiation to induce senescence. (A) Immunostaining for vinculin (green), actin (red), and DAPI (blue) was used to visualize the actin organization and focal adhesion (FA) distribution of pre-senescent (Pre-sen) and senescent (Sen) MSCs. Scale bars: 50 µm. (B) Quantification of physical cell parameters revealed senescence induced a significant increase in the cell and nuclear area. (C) Scatter plot of average FA area (Avg FA Area) against the normalized distance (Norm Dist) of FAs from the centroid of the cell demonstrated the altered distribution between pre-senescent and senescent cells. FA size increased more sharply with distance from the centroid in pre-senescent MSCs compared to in senescent MSCs. Average stress fiber length increased by ∼10% in senescent cells compared to the control. (D) Cytoskeletal mechanics was assessed by tracking the motion of 200-nm probe particles embedded in the cytosol (n>15 cells/condition, n=10–20 particles/cells, n>200 particles/condition). Time-dependent ensemble average MSDs increased linearly with time-scale for both pre-senescent and senescent MSCs; however, the MSD distributions were narrower for senescent MSCs. Colored lines represent individual traces from each particle MSD, whereas the black line represents the ensemble average MSD of all particles. Coefficient of variations (CVs) were calculated for cytoskeletal MSDs at t=0.1, t=1 and t=10 s. Pre-senescent MSCs displayed significantly higher CVs compared to senescent cells at t=1 and t=10 s. (E) Nuclear mechanics was assessed by tracking Hoechst 33342-labeled chromatin in the nuclei. At short time-scales (≪ 1 s) the MSDs were independent of time, resembling particle motion in more elastic material; however, at later time scales (≫ 1 s) nuclei transitioned to more viscous behavior, as indicated by an increasing MSD slope. Colored lines represent traces from each tracked condensed chromatin spot, whereas the black line represents the ensemble average of all tracks. CVs were calculated for nuclear (Nuc) MSDs at t=0.1, t=1 and t=10 s. Pre-senescent MSCs displayed significantly higher CVs compared to senescent cells at t=10 s. Results are mean±s.e.m.; *P<0.05 (Student's t-test).

