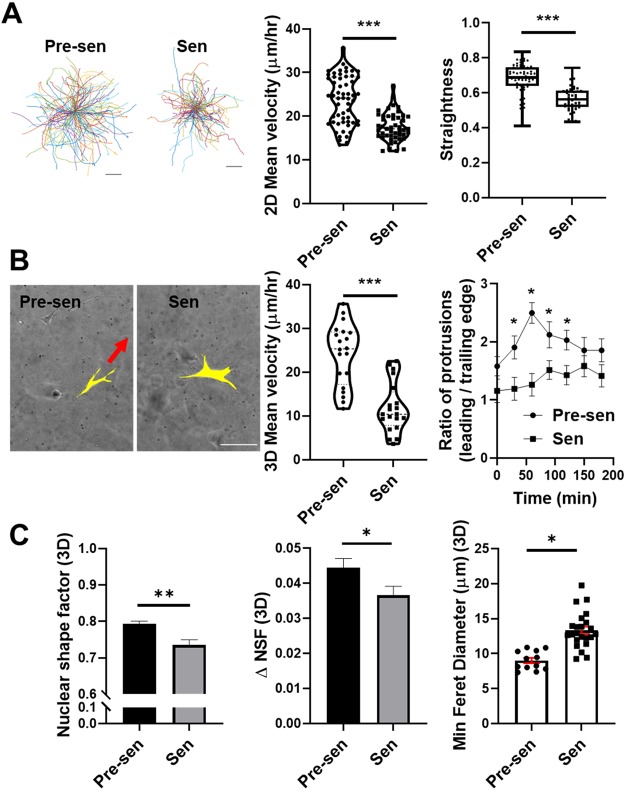
Fig. 2.
Senescence reduced MSC migration significantly in 2D and 3D. (A) Representative traces of single-cell motions for pre-senescent (Pre-sen) and senescent (Sen) MSCs and dot plots representing single-cell mean velocities, assessed by tracing the motion of Hoechst 33342-stained nuclei over 12-h time period at 10 min intervals. Straightness of cell migration was calculated using total path length over net displacement to assess persistent motion and is shown as a box-and-whisker plot, where the box represents the 25–75th percentiles, and the median is indicated. The whiskers show the minimum and maximum value of the data points. (B) MSCs were embedded in collagen and imaged at 15-min intervals over a 12-h time period. Pre-senescent MSCs formed leading edge protrusions in the direction of migration, whereas senescent MSCs formed protrusions in multiple directions but were unable to move forward. Scale bar: 100 µm. Based on nuclear xy coordinates, we tracked hundreds of individual cells for each condition; the mean velocity of senescent MSCs was reduced (P<0.001). For both cell types, leading edge and trailing edge protrusions were counted; we report the mean±s.e.m. ratio of leading to trailing edge protrusions, which characterizes the likelihood of cells being able to move forward. (C) Nuclear shape factor (NSF), change in NSF (ΔNSF), and minimum feret diameter were quantified for MSCs in 3D collagen gels. Senescent MSC nuclei were slightly more elongated but less deformable resulting in higher feret diameters that limited their migration in porous collagen networks. Results are mean±s.e.m. *P<0.05, **P<0.01, ***P<0.001 (Student's t-test).

