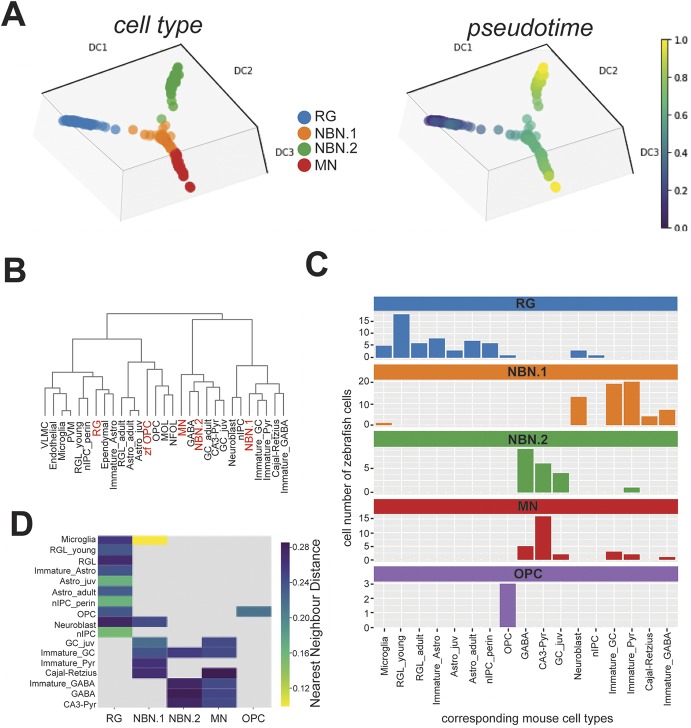
Fig. 4.
The differentiation trajectory of zebrafish radial glia progeny clusters resembles mammalian adult neurogenesis. (A) Lineage trajectory analysis of single cell RNAseq data from RG, NBNs and MNs of the adult zebrafish forebrain. Color coding corresponds to the different cell clusters identified in Fig. 2B (left) or indicates the pseudotime progression (right). (B) Unbiased hierarchical clustering of transcriptome profile from zebrafish cell clusters (red) with cell types from the developing and adult murine hippocampus (black), showing dispersed co-distribution of zebrafish cell clusters with related mammalian cell types. (C) Quantification of distribution of zebrafish cell clusters over the different corresponding murine cell types for RG (blue), NBN.1 cells (orange), NBN.2 cells (green), MNs (red) and OPCs (purple). Bars specify the number of zebrafish cells (y-axis) corresponding to the indicated murine cell type (x-axis). (D) Heatmap depicting the similarity of zebrafish cell clusters with their corresponding murine cell types based on the k-nearest neighbor distance. Lower distances indicate higher similarities.

