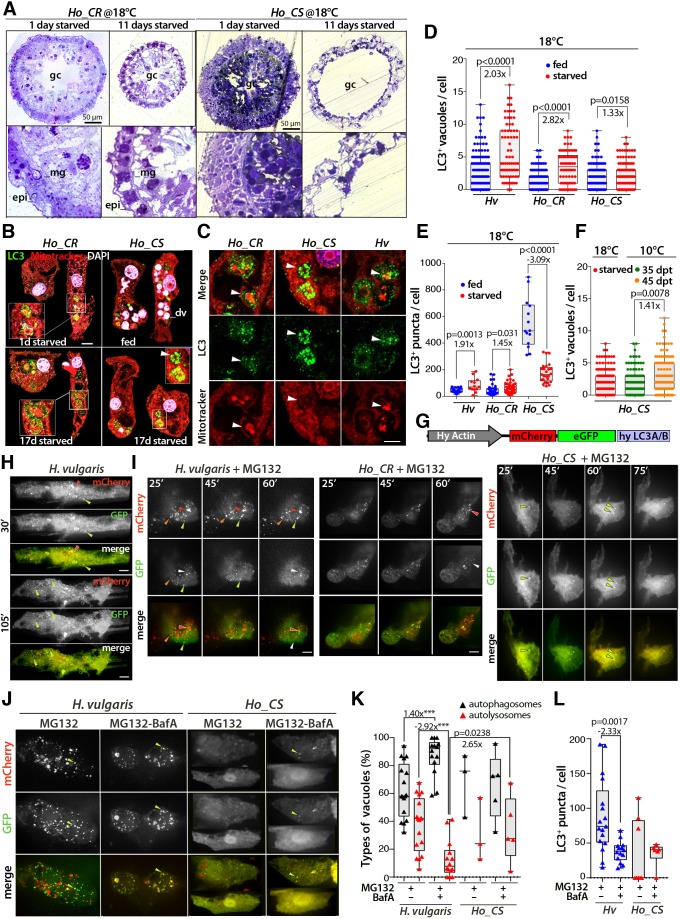
Fig. 4.
Deficiency in the inducibility of the autophagy flux in ESCs from Ho_CS animals. (A) Toluidine-stained transversal sections of gastric regions from 1- and 11-day starved animals. Lower panel show enlarged areas of the panels above. epi, epidermis; gc, gastric cavity; mg, mesoglea. (B) Detection of autophagic vacuoles (arrowhead) and digestive vacuoles (dv, pink) in epithelial cells immunostained for LC3 (green) and stained with MitoTracker (red) and DAPI (white). Scale bar: 10 µm. (C) Enlarged view of the LC3+ structures shown in B. Arrowheads indicate circular LC3+ structures surrounding sequestered portions of cytoplasm. Scale bar: 5 µm. (D,E) Number of LC3+ vacuoles (D) or LC3 puncta (E) in ESCs of regularly fed or 17-day starved Hv, Ho_CR and Ho_CS animals maintained at 18°C. (F) Number of LC3+ vacuoles in ESCs of Ho_CS maintained at 10°C for 35 or 45 days. (G) Structure of the mCherry-eGFP-hyLC3A/B dual autophagy sensor. (H,I) Live imaging of ESCs expressing the autophagy sensor in regularly fed Hv, Ho_CR or Ho_CS animals maintained at 18°C either untreated (H) or exposed to MG132 immediately before imaging (I). Green arrowheads indicate autophagosomes, orange arrowheads autophagosomes losing GFP fluorescence and red and white arrowheads autolysosomes. (J) Live imaging of ESCs expressing the autophagy sensor in Hv or Ho_CS animals exposed before imaging to MG132 for 3 h and to BafA (100 nM) for 16 h or not. Green arrowheads indicate autophagosomes. (K) Distribution of the LC3+ vacuoles between autophagosomes (black triangles) and autolysosomes (red triangles). (L) Number of LC3+ puncta in the cells shown in J. For box and whisker plots, the box indicates the 25th to 75th percentile, the line shows the median and the whiskers indicate the smallest and the largest value. Points represent individual values. P-values calculated using unpaired t-test. ***P=0.0003.

