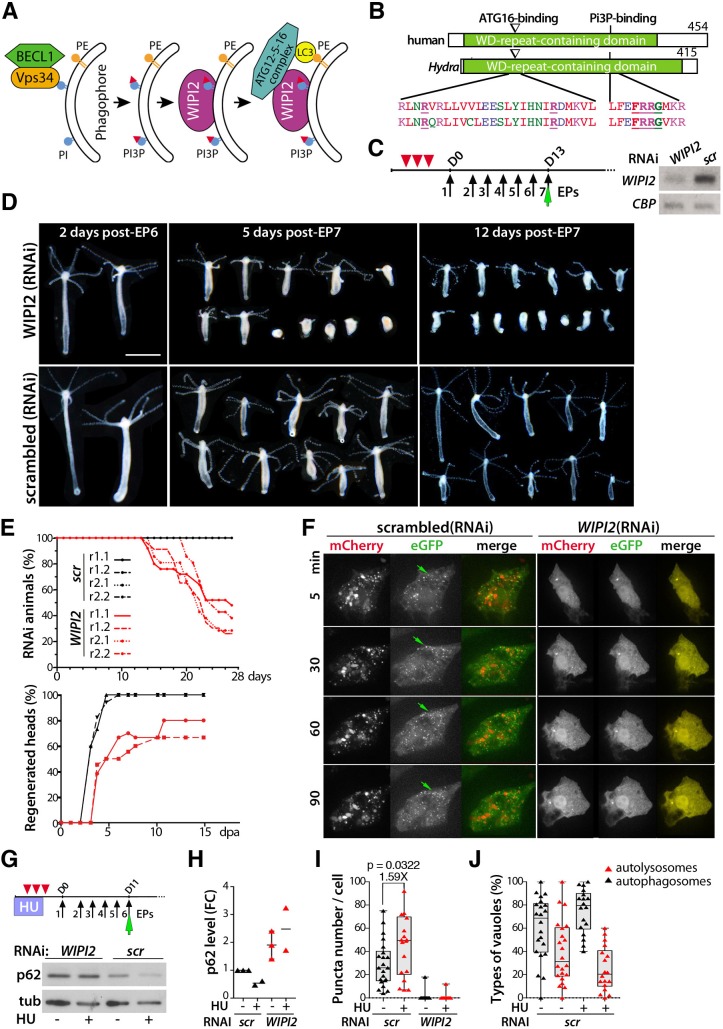
Fig. 7.
Deficient autophagy flux upon WIPI2 silencing in H. vulgaris. (A) Scheme showing the role of WIPI2 in autophagosome formation (adapted from Dooley et al., 2014). (B) Structure of the human and Hydra WIPI2 proteins and alignment of the regions involved in ATG12-5-16 complex or PI3P binding. (C) Left: RNAi procedure used to knock down WIPI2 expression in intact animals. Red arrowheads indicate feedings preceding siRNAi delivery, black arrows indicate siRNA electroporation (EP), green arrow indicates co-electroporation of the mCherry-eGFP-hyLC3 autophagy sensor on EP7. Right: WIPI2 and CBP (CREB-binding protein) RNA levels measured by RT-PCR in animals exposed to WIPI2 or scrambled (scr) siRNAs. D, day. (D) Phenotypic analysis of WIPI2(RNAi) and scrambled(RNAi) animals post-EP6 or -EP7. Scale bar: 1 mm. Note that all images have been cut and aligned on black background for ease of comparison. (E) Mortality rates recorded after EP7 and head regeneration efficiency in animals bisected at mid-gastric level 24 h after EP6. (F) Live detection of LC3 vacuoles in epithelial cells from WIPI2(RNAi) or scr(RNAi) animals 2 days post-EP7. MG132 added just before imaging. Green arrows indicate formation of GFP+ puncta in scr(RNAi) cells. (G-J) WIPI2 silencing in HU-treated animals. (G) p62 and tubulin levels in Hv animals electroporated six times with WIPI2- or scr-siRNAs. (H) Fold change (FC) in p62 levels in animals exposed or not to HU and knocked down or not for WIPI2; each triangle represents a distinct experiment. (I,J) Imaris quantification of LC3 puncta (I), and autophagosomes and autolysosomes (J) in epithelial cells of WIPI2(RNAi) or scr(RNAi) animals expressing the autophagy sensor, imaged 2 days post-EP7. Vacuoles were quantified 3 h after MG132 exposure. For box and whisker plots, the box indicates the 25th to 75th percentile, the line shows the median and the whiskers indicate the smallest and the largest value. Points represent individual values. P-values calculated using the unpaired t-test.

