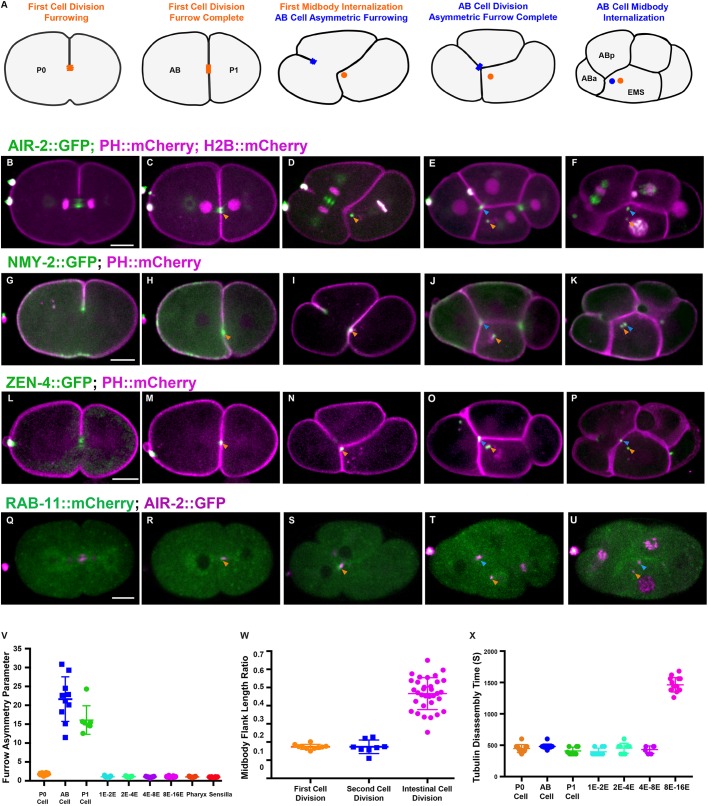
Fig. 1.
Cytokinesis in the first two mitotic divisions. (A) Illustration of cytokinesis in the first two mitotic divisions. The first midbody is shown in orange, the AB midbody is blue. (B-F) Cytokinesis labeled with AIR-2::GFP (green; PH::mCherry and H2B::mCherry in magenta). AIR-2 localizes on the central spindle (B) and the midbody flank (C, orange arrowhead) and the MBR after internalization in AB (D, orange arrowhead). In the AB division, the asymmetric furrow pushes the midzone against EMS (E, blue arrowhead), which engulfs it (F, blue arrowhead). (G-K) NMY-2::GFP (green; PH::mCherry in magenta) localizes to the furrow (G) and midbody ring (H-K). (L-P) ZEN-4::GFP (green; PH::mCherry in magenta) appears on the central spindle (L) and the midbody (M-P). (Q-U) RAB-11::mCherry (green) colocalized with AIR-2::GFP (magenta) at the midbody for a short time before internalization (R-U). Arrowheads in G-U are as described for B-F. (V) Furrow asymmetry parameter is shown for different divisions. (W) Ratio of midbody microtubule length to cell length in different divisions. (X) Quantification of microtubule persistence in different cell divisions. Error bars indicate s.d. Scale bars: 10 μm.

