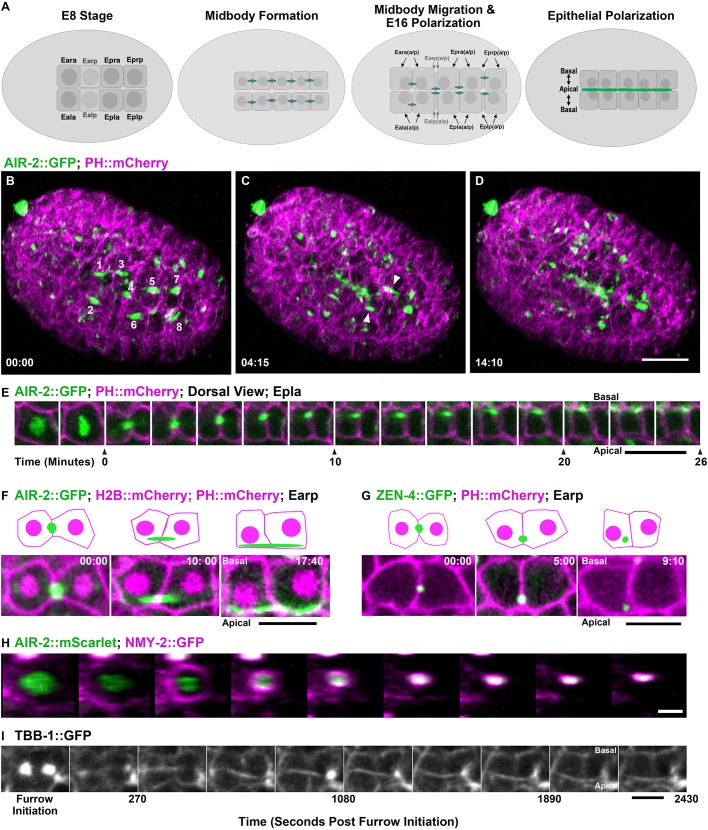
Fig. 2.
Midbody migration and Aurora B apical localization after E8-E16 intestinal divisions. (A) Diagram of intestinal E8-E16 divisions indicating Aurora B localization (green; midbody ring in magenta). (B-D) Lattice light-sheet imaging of E8-E16 divisions with AIR-2::GFP (green) with PH::mCherry (magenta). AIR-2::GFP labels midbodies (labeled 1-8 in B) that migrate to the nascent apical surface (arrowheads, C) where it persists (D). Scale bar: 10 μm. (E) Montage of Epla division with AIR-2::GFP (green; PH::mCherry in magenta) showing midbody formation (t=0) and migration to the apical midline. Scale bar: 5 μm. (F,G) Comparison of AIR-2::GFP (F) and ZEN-4::GFP (G) localization to the apical midline. Scale bars: 5 μm. Time shown in minutes:seconds. In schematics, midbody is green, H2B::mCherry and PH::mCherry are magenta. (H) En face view of the E8-E16 contractile ring labeled with NMY-2::GFP (magenta; AIR-2::mScarlet in green; images taken at 90 second intervals) shows symmetrical furrowing. Scale bar: 2 μm. (I) Single z-plane imaging of midbody flank microtubules during Epra cell division. Scale bar: 5 μm.

