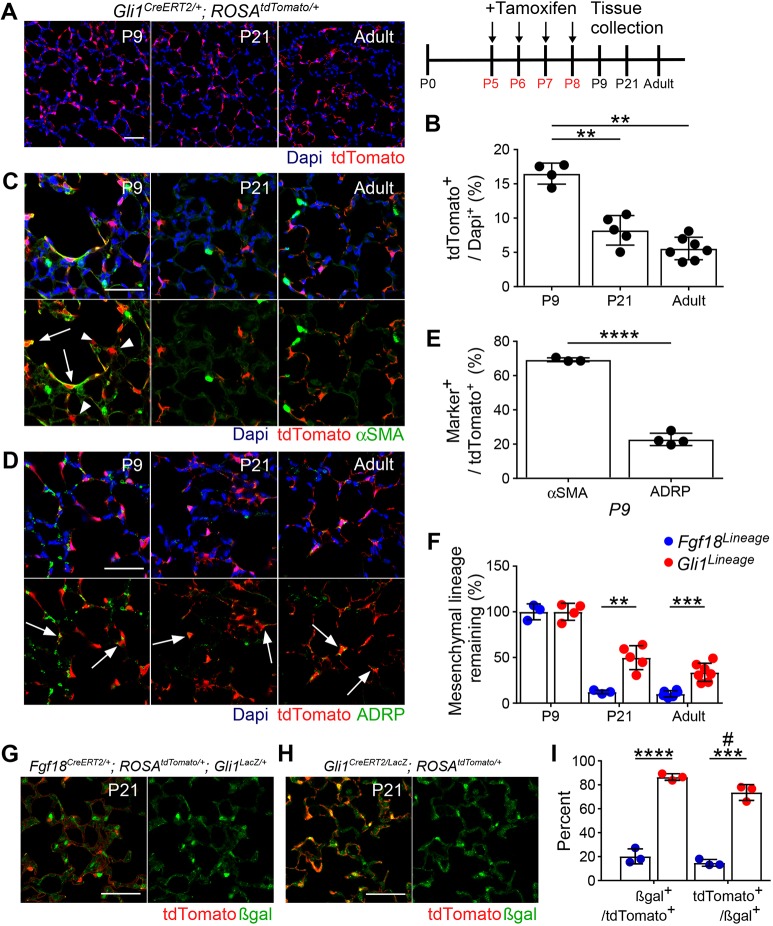
Fig. 5.
Most Gli1CreERT2-labeled alveolar myofibroblasts are cleared at the end of alveologenesis, whereas alveolar lipofibroblasts remain. (A) Gli1CreERT2/+; ROSAtdTomato/+ mice were injected with Tam daily from P5 to P8 and lungs were analyzed at P9, P21 and in the adult (≥8 weeks). (B) Quantification of the percentage of DAPI+ cells in the alveolar region that are tdTomato+. One-way ANOVA, P=9.8×10⁻⁷. **α<0.01, Tukey's HSD. n=4 (P9), n=5 (P21) and n=7 (adult). (C,D) Colocalization of tdTomato (red) in lineage-traced mice with: (C) alveolar myofibroblast marker αSMA (green) and (D) alveolar lipofibroblast marker ADRP (green). (E) Quantification of the percentage of tdTomato+ cells that colocalize with αSMA and ADRP at P9. Student's t-test, ****P<0.0001. n=3 (αSMA), n=4 (ADRP). Arrows indicate localization of signals. Arrowheads indicate tdTomato+ αSMA− cells. (F) Quantification of the percentage of remaining mesenchymal lineage tdTomato+ cells in Fgf18Lineage and Gli1Lineage mice. Fgf18 data from Fig. 3H and Gli1 data from Fig. 5D are normalized to P9 for comparison. The entire Gli lineage was considered mesenchymal as there was no contribution to other lineages. Student's t-test, **P<0.01; ***P<0.001. Fgf18 lineage: n=3 for P9 and P21, n=6 for adult. Gli1 lineage: n=4 (P9), n=5 (P21), n=7 (adult). (G,H) Fgf18CreERT2/+; ROSAtdTomato/+; Gli1LacZ/+ mice (G) and Gli1CreERT2/LacZ; ROSAtdTomato/+ mice (H) were injected with Tam daily from P5 to P8 and lungs were collected at P21. Colocalization of tdTomato (red) with βgal (green). (I) Quantification of the percentage of βgal+/tdTomato+ cells and tdTomato+/βgal+ cells in the alveolar region in Fgf18Lineage versus Gli1Lineage mice. Student's t-test, ***P<0.001; ****P<0.0001. Mann–Whitney, #u=0.10. n=3 DAPI (blue). Scale bars: 50 µm. Data are mean±s.d.

