FIG. 2.
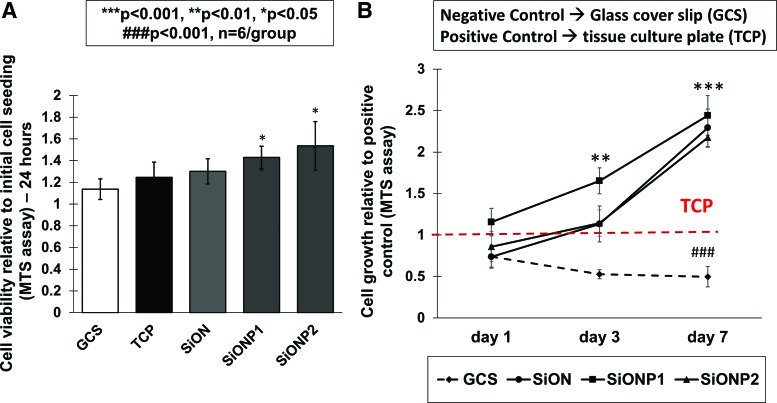
Cell viability and proliferation. (A) Graph shows cell viability after 24 h (MTS assay). (B) Chart shows cell growth after 1, 3, and 7 days (MTS assay). ANOVA, ***p < 0.001, **p < 0.01, *p < 0.05, ###p < 0.001 indicate statistical significance, n = 6 per group. Color images are available online.

