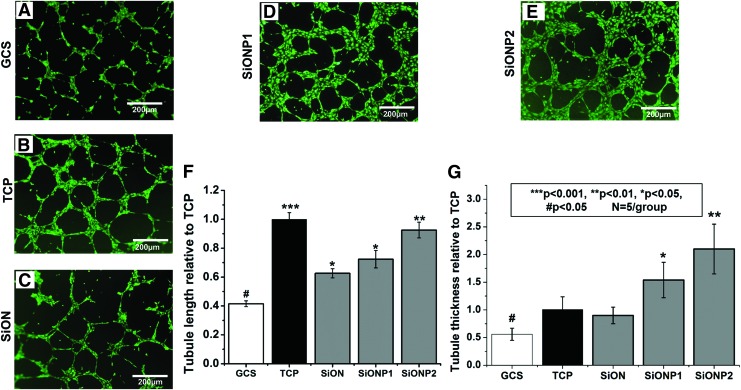
FIG. 5.
Capillary tubule formation 6 h after culture on bed of Matrigel®. (A–E) Fluorescent images captured after Calcein-AM staining. Scale bar = 200 μm. (F) Bar graph shows tubule length relative to TCP (positive control). (G) Bar graph shows tubules thickness relative to TCP (positive control). ANOVA, ***p < 0.001, **p < 0.01, *p < 0.05, #p < 0.05 indicate statistical significance, n = 4 per group. Color images are available online.

