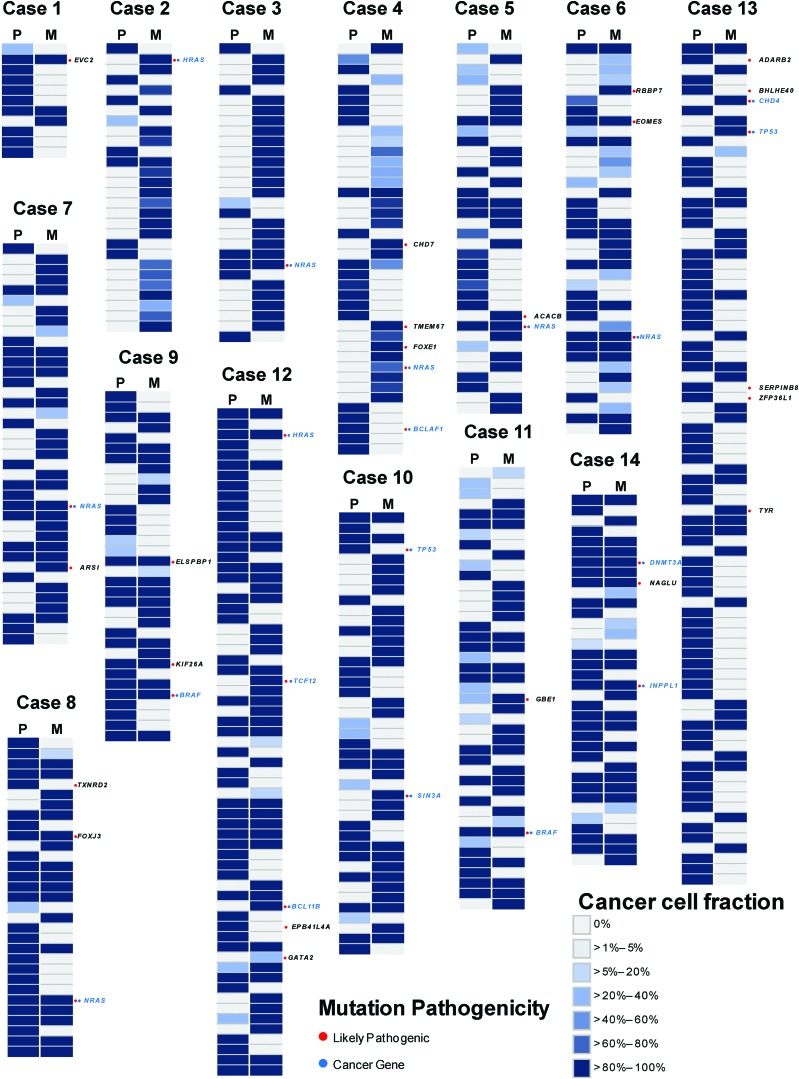
FIG. 2.
Genetic repertoire of somatic mutations in primary and metastatic lesions. Heat maps show the CCF of somatic mutations demonstrated by the ABSOLUTE algorithm with their presence (blue, see color key for the CCF percentage) or absence (light gray) in the primary and metastatic deposits. Likely pathogenic mutations are indicated by red circles, and the affected genes are shown for each lesion. Likely pathogenic mutations affecting cancer genes are indicated by blue circles in each lesion, labeled in blue. CCF, cancer cell fraction. Color images are available online.

