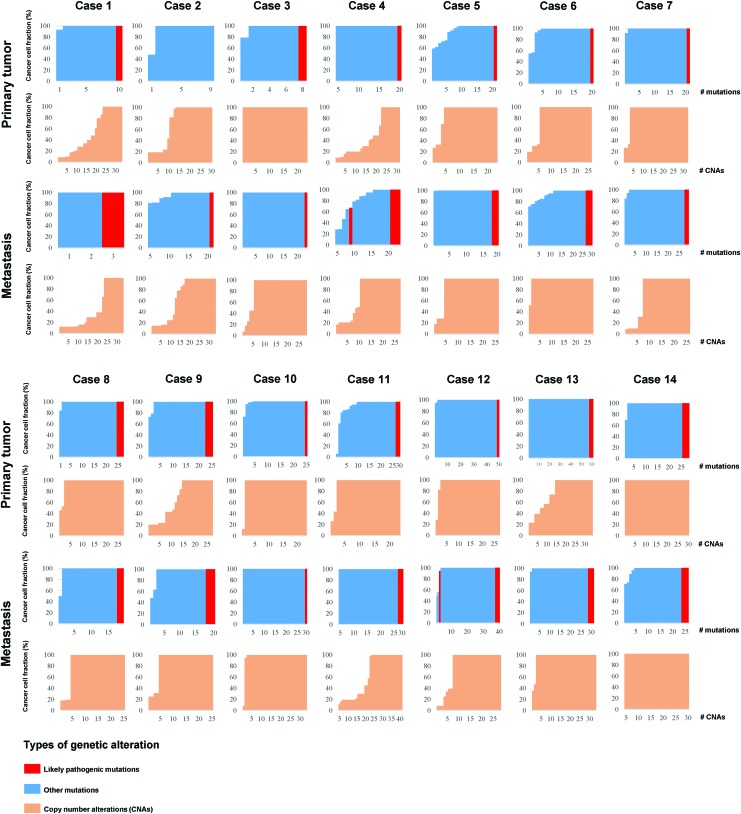
FIG. 6.
Dynamics of somatic mutations and CNAs. The figure shows the CCFs of the somatic mutations (red and blue) and of the CNAs (orange, excluding amplifications; see the Methods section). CCFs of the somatic mutations and the CNAs are sorted in increasing order. Color images are available online.

