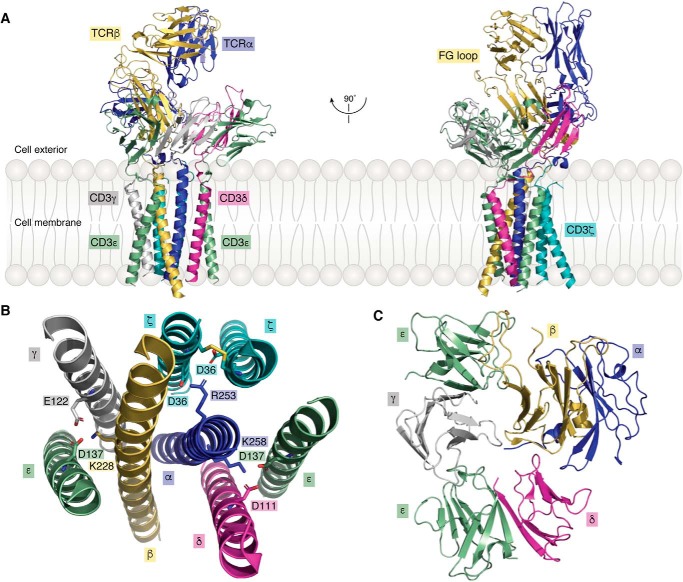
Figure 2.
Structure of the TCR–CD3 complex. A, side views of the overall structure of the TCR–CD3 complex shown in ribbon representation (PDB code 6JXR) (23). B, top view of the TM segments of the TCR–CD3 complex. Side chains of acidic and basic residues forming ionic interactions within the membrane are shown. C, top view of the ECDs of the TCR–CD3 complex.

