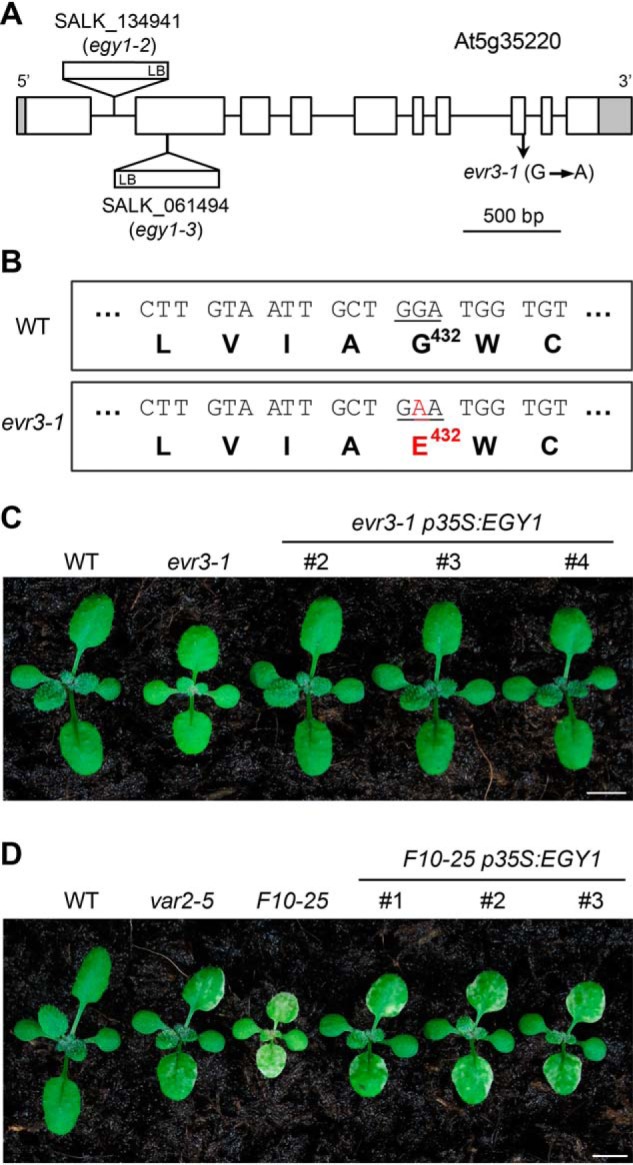
Figure 2.

Identification of the EVR3 locus. A, schematic representation of the mutation sites in evr3–1 and two T-DNA insertion lines, egy1–2 and egy1–3 in the At5g35220 gene model. Introns and exons were represented by solid lines and boxes, respectively. Shaded boxes indicated 5′ and 3′ untranslated regions. B, the G432E mutation identified in evr3–1. C, phenotypes of representative 2-week-old WT, evr3–1, and three independent complementation lines expressing p35S:EGY1 in evr3–1 background. Bar, 5 mm. D, phenotypes of representative 2-week-old WT, var2–5, evr3–1, and three independent complementation lines expressing p35S:EGY1 in F10–25 background. Bar, 5 mm.
