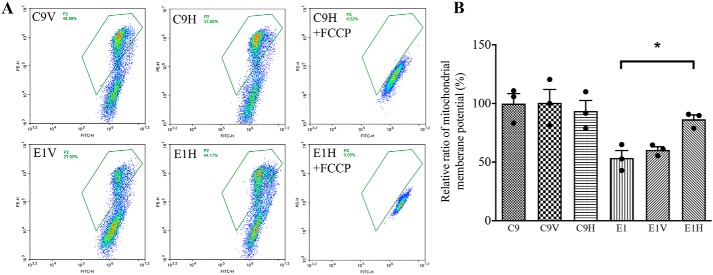
Figure 11.
Mitochondrial membrane potential analysis. A, ΔΨm was measured in six cell lines by a BD-LSR II flow cytometer system using a fluorescence probe JC-10 assay system. The ratios of fluorescence intensity excitation/emission = 490/590 and 490/530 nm (FL590/FL530) were recorded to delineate the ΔΨm level of each sample. Represented are flow cytometry images of cell lines E1V and E1H with and without 10 μm FCCP. B, the ratios of the population with a normal level of ΔΨm relative to the control cell line C9 were calculated to reflect the level of ΔΨm. The average of three determinations for each cell line is shown. Graph details and symbols are explained in the legend to Fig. 4. Error bars, S.D.

