Figure 2.
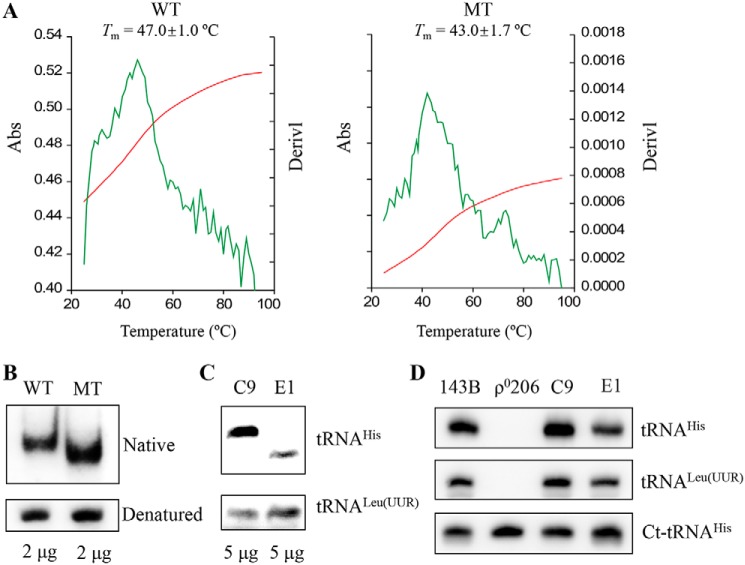
Analysis for the stability and conformation of tRNAHis. A, melting profiles of WT and MT tRNAHis transcripts were measured at 260 nm with a heating rate of 1 °C/min from 25 to 95 °C (red curves). First derivatives (dA/dT) against temperature curves are shown to highlight the Tm value transitions (green curves). The calculations were based on three independent determinations. The graph shows the results of a representative experiment. B, assessment of conformational changes by PAGE analysis under native and denaturing conditions. The transcripts of WT and MT tRNAHis were electrophoresed through native or denaturing polyacrylamide gel stained with ethidium bromide. C, Northern blot analysis of tRNAs under native conditions. D, Northern blot analysis of tRNAs from various cell lines under denatured conditions. Five micrograms of total cellular RNAs from mutant and control cell lines were electrophoresed through native polyacrylamide gel, electroblotted, and hybridized with DIG-labeled oligonucleotide probes specific for the tRNAHis, tRNALeu(UUR), and ct-RNAHis, respectively.

