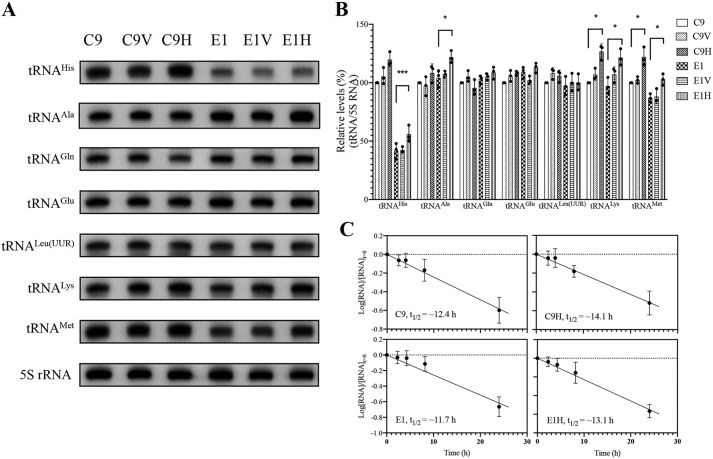
Figure 5.
Northern blot analysis of mitochondrial tRNA under denaturing conditions. A, 5 μg of total cellular RNA from various cell lines were electrophoresed through a denaturing polyacrylamide gel, electroblotted, and hybridized with DIG-labeled oligonucleotide probes for the tRNAHis, tRNAAla, tRNAGln, tRNAGlu, tRNALeu(UUR), tRNALys, tRNAMet, and 5S rRNA, respectively. B, quantification of mitochondrial tRNA levels. Average relative tRNA content per cell was normalized to the average content per cell of 5S rRNA. The values for the latter are expressed as percentages of the average values for the control cell line C9. The calculations were based on three independent determinations. C, decay kinetics of tRNAHis in two transfectants (C9H and E1H) and their parental cell lines (C9 and E1). tRNA levels were measured using ImageJ analysis of Northern blots probed for tRNAHis and 5S rRNA using RNA isolated from cells at various time courses during EtBr treatment. RNA levels expressed as a fraction of the signal obtained from a panel of replicates taken at zero time (the time at which EtBr was added) were converted to logarithms on the assumption of first-order decay kinetics. All hybridization signals were normalized to 5S rRNA as the loading control. The data plotted represent the mean ± S.D. (error bars) of three independent experiments. Lines of best fit (least squares method) are shown, r2 for the four panels (clockwise, from top left) being 0.991, 0.987, 0.989, and 0.945, respectively. Graph details and symbols are explained in the legend to Fig. 4.

