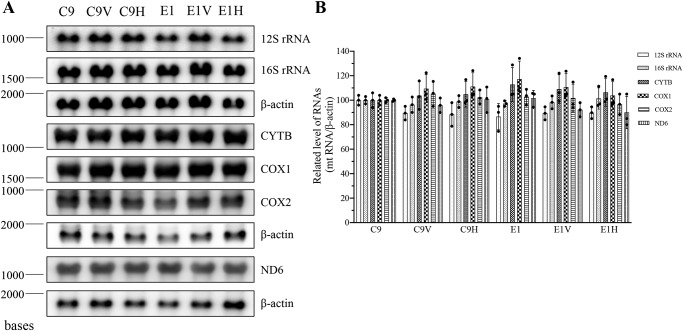
Figure 6.
Northern blot analysis of mitochondrial RNAs. A, 5 μg of total cellular RNA from various mutant and control cell lines were electrophoresed through a 1.5% agarose-formaldehyde gel; transferred onto a positively charged membrane; and hybridized with DIG-labeled RNA probes for ND6 (from L-strand transcript), COX1, COX2, CYTB, 12S rRNA, and 16S rRNA (from H-strand transcript), and β-actin as a control, respectively. B, average relative levels of above mRNAs and rRNAs per cell were normalized to the average level per cell of β-actin in three control cell lines and three mutant cell lines. The values for the latter are expressed as percentages of the average values for the control cell lines. Three independent determinations were used in the calculations. Graph details and symbols are explained in the legend to Fig. 4. Error bars, S.D.

