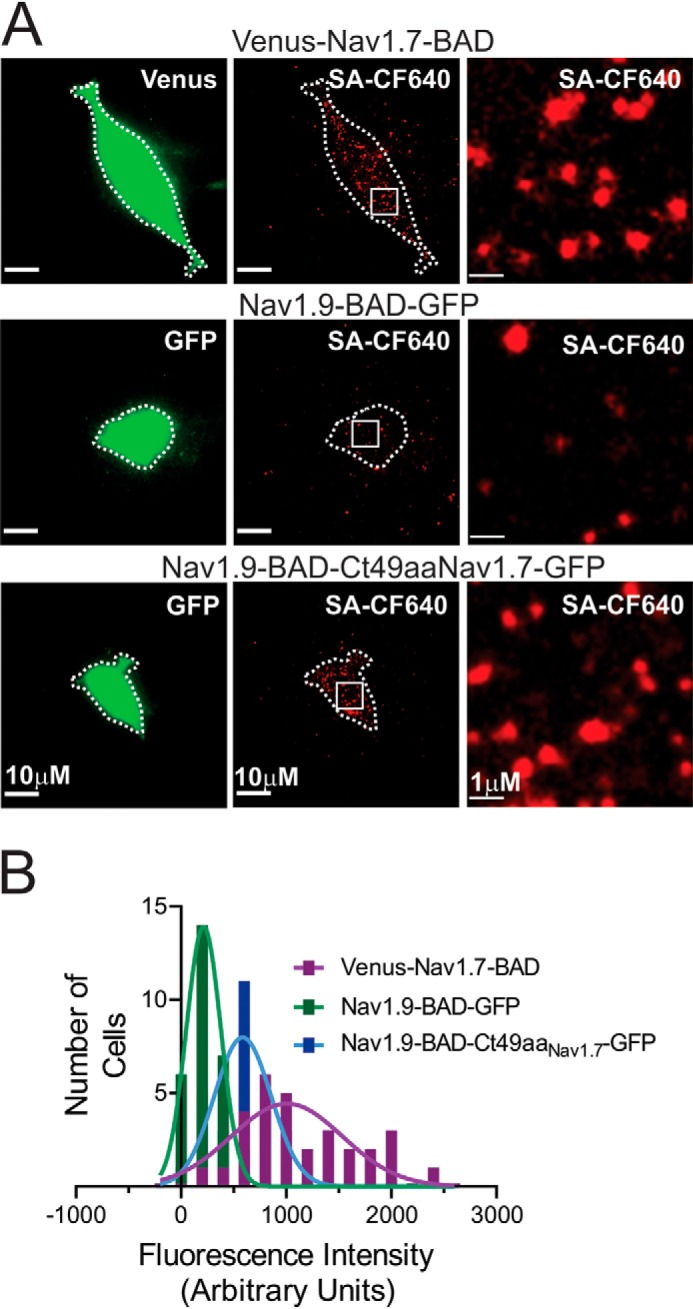
Figure 9.

Imaging of Nav1.9 and Nav1.7 channels at the cell surface in HEK293 cells. A, representative TIRF images (green, 488-nm laser, first column of images; red, 647-nm laser, second column) of HEK293 cells transfected with any of the three constructs Venus-Nav1.7-BAD, Nav1.9-BAD-GFP, and Nav1.9-BAD-Ct49aaNav1.7-GFP. The third column shows ×10 magnified areas (insets marked by a square) within images from the second column. B, histograms of surface fluorescence intensity of SA-CF-640R–labeled Nav1.9-BAD-GFP (green), Nav1.9-BAD-Ct49aaNav1.7-GFP (blue), and Venus-Nav1.7-BAD (purple) channels on HEK293 cell surface. Solid green, blue, and purple lines are fits to the histogram distribution of the Nav1.9-BAD-GFP and Venus-Nav1.7-BAD constructs, respectively, with a mean value of 249 ± 38 AU, n = 30 for Nav1.9-BAD-GFP; 658 ± 64 AU, n = 30 for Nav1.9-BAD-Ct49aaNav1.7-GFP; and 1156 ± 100 AU, n = 30 for the Venus-Nav1.7-BAD construct. Differences between these values are statistically significant (one-way ANOVA (F(2, 87) = 9.769, p = 0.0001), followed by Tukey's multiple-comparison test).
