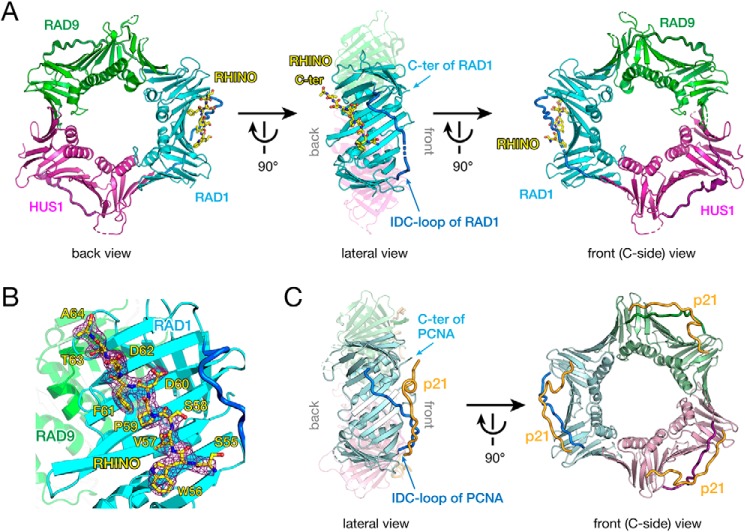
Figure 1.
A, overall structure of 9-1-1 bound to the RHINO peptide. RAD9, RAD1, and HUS1 subunits are shown as green, cyan, and magenta cartoons, respectively. The IDC-loop of each subunit is shown as a darker-colored thick tube. The RHINO peptide is shown as a yellow stick. Left, back view of 9-1-1 bound to the RHINO peptide. Center, lateral view of 9-1-1 bound to the RHINO peptide. For clarification, RAD9 and HUS1 are shown as semitransparent models. The C terminus and IDC-loop of RAD1 are indicated by arrows. Right, front view (C-side) of 9-1-1 bound to the RHINO peptide. B, the electron density map of the RHINO peptide bound to RAD1. The σ-A weighted 2Fo − Fc map of the peptide contoured at 1σ is shown as a purple cage. RHINO, RAD9, and RAD1 are colored as shown in A. Residues of the RHINO peptide are labeled. C, overall structure of PCNA bound to the p21 peptide (PDB entry 1AXC) as a representative structure of the PCNA-partner complex. Subunits of the homotrimer are shown as light green, pale blue, and pink cartoons. The IDC-loop of each subunit is shown as darker-colored thick tube. The p21 peptide is shown as an orange tube. Left, lateral view of PCNA bound to the p21 peptide. For clarification, far subunits (light green and pink) are shown as transparent models. The C terminus and IDC-loop of PCNA are indicated by arrows. Right, front view (C-side) of PCNA bound to the p21 peptide. The orientation PCNA in each view corresponds to that of 9-1-1 in A.

