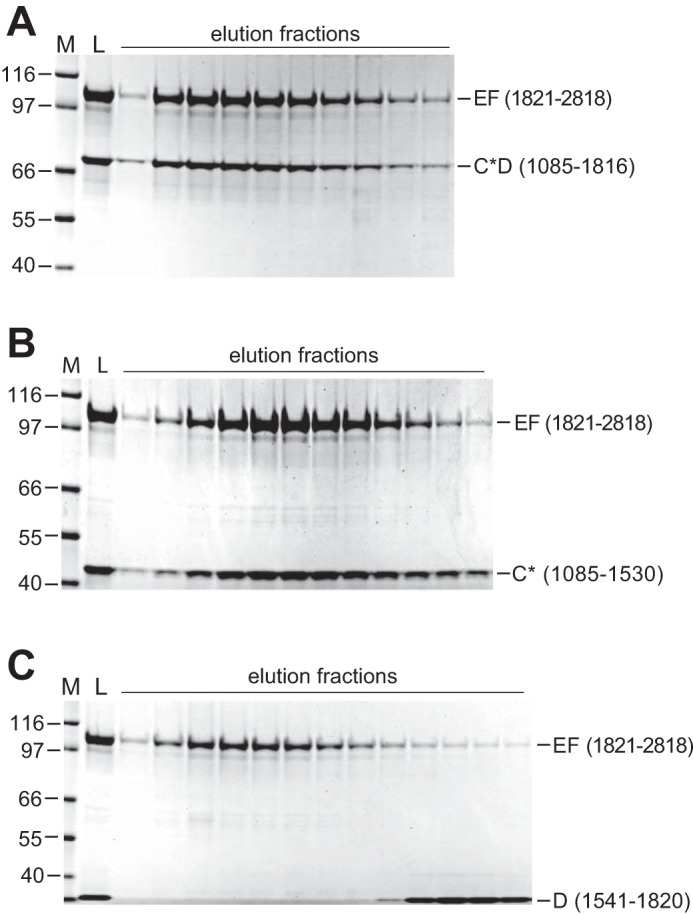
Figure 7.

Identification of the interaction between the neurofibromin C and EF domains. SDS-PAGE analysis of SEC of equimolar mixtures of NF1 domains with EF(1821–2818). In each panel, the size of molecular mass markers in lane M is noted in kilodaltons. Lane L represents the loaded material, and additional lanes are elution fractions across the column. Neurofibromin fragments mixed with the EF domain in each panel were as follows: A, 1085–1816; B, 1085–1530; C, 1541–1820.
