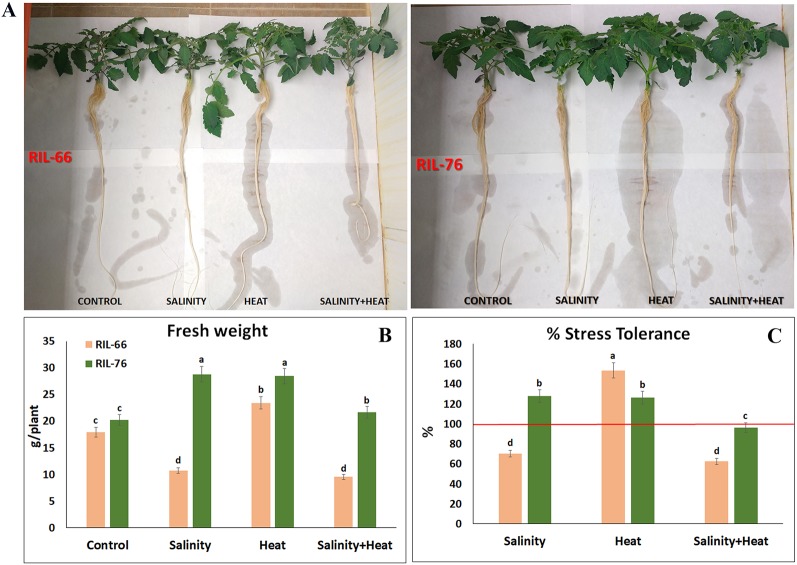
Figure 2.
Phenotypes and tolerance rate in tomato recombinant inbred line (RIL)-66 and RIL-76. (A) Phenotypes obtained in tomato RIL-66 and RIL-76 under control, salinity, heat stress, and the combination of salinity + heat stress. (B) Fresh weight (FW) of the tomato RIL-66 and RIL-76 at the end of the experiment (15 days of treatments). (C) Percentage of tolerance to salinity, heat, and the combination of salinity and heat obtained in RIL-66 and RIL-76 respect to their controls (red line = 100% of tolerance). Bars are mean values ± SE (n = 6), and bars with different letters are significantly different at p < 0.05 according to Tukey's test. (n = 6).

