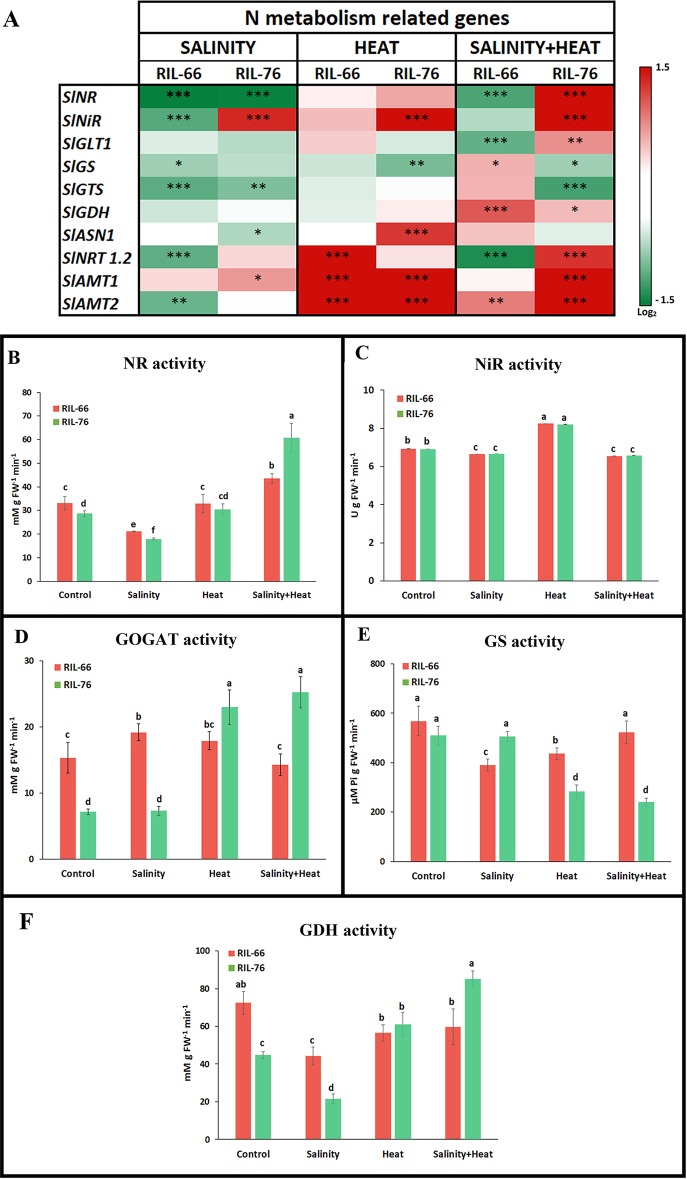
Figure 6.
Expression and activities of the genes and enzymes involved in nitrogen (N) assimilation pathway. (A) Heat map of the expression of the N-metabolism related transcripts in leaves of RIL-76 (salt + heat tolerant) and RIL-66 (salt+heat sensitive) under salinity, heat, or the combination of salinity and heat. Scale is log2 of the mean values after normalization against control plants (n = 6). Asterisks are representative of significant differences at p < 0.05 (*p < 0.05; **p < 0.01; ***p < 0.001). (B–F)Absolute activities of the N-assimilation pathway related enzymes in recombinant inbred line (RIL)-66 and RIL-76 under control, salinity, heat, or the combination of salt+heat. Bars are mean values ± SE (n = 6), and bars with different letters are significantly different at p < 0.05 according to Tukey's test. (n = 6).

