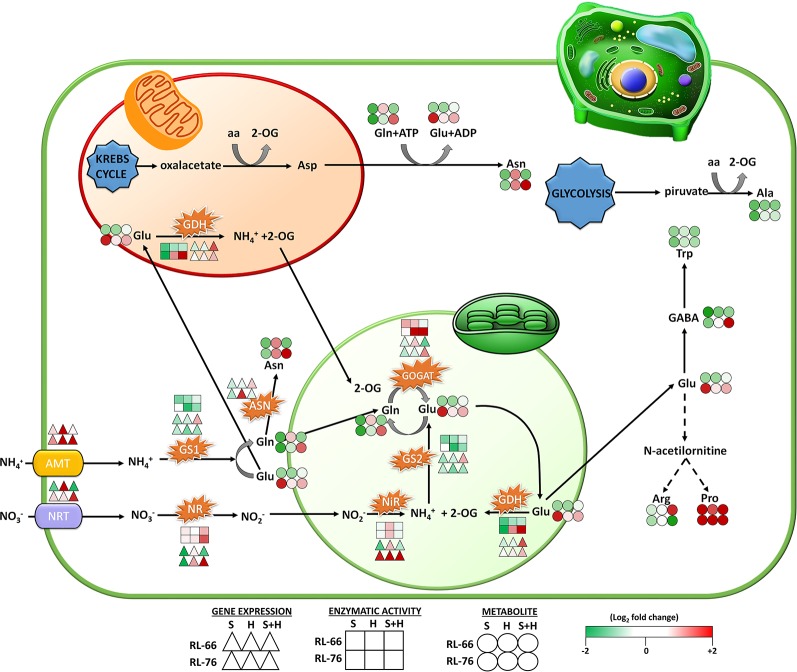
Figure 7.
Scheme of the proposed changes occurring in the nitrogen (N)-assimilation pathway. Changes were represented in recombinant inbred line (RIL)-66 (salt+heat sensitive; up row symbols) and RIL-76 (salt+heat tolerant; down row symbols) under salinity, heat, or the combination of salinity and heat at gene (Δ), enzyme (□), and metabolite (○) levels. Changes are expressed as the log2 of the normalized values against the respective control values obtained in each recombinant line (n = 6).

