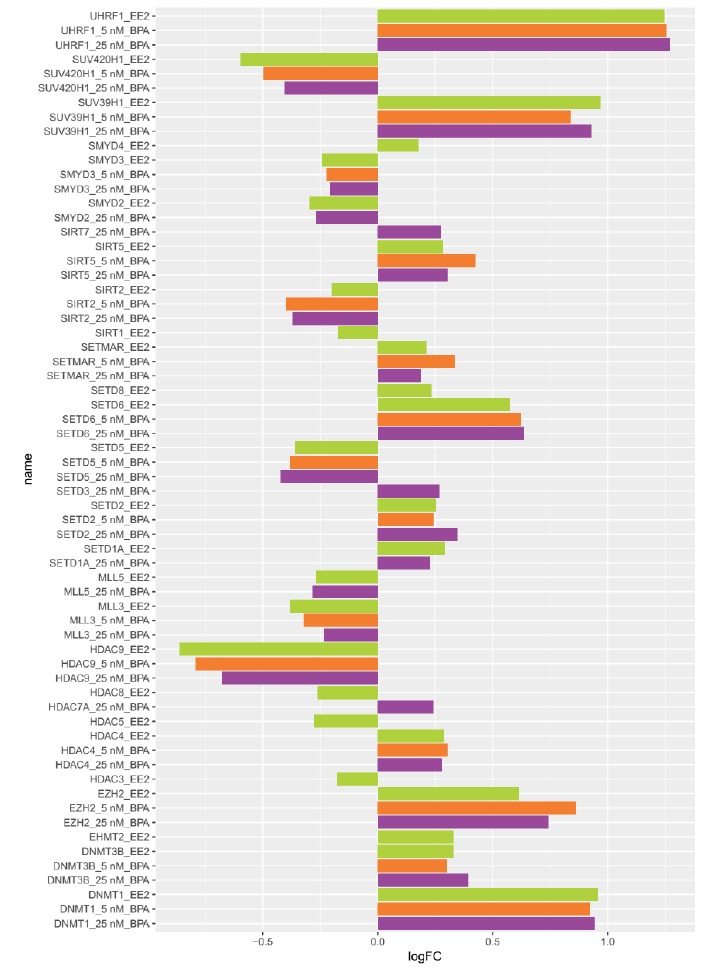
Fig. (5).

Expression levels of transcripts encoding histone and DNA methylation modifying enzymes after exposure to 5 nM BPA (orange), 25 nM BPA (purple) and 0.1 nM EE2 (green). Expression is shown as log Fold Change (logFC) relative to the control for genes with a q-value ≤ 0.1. Genes not DE in the comparisons are not shown in the plot. .
