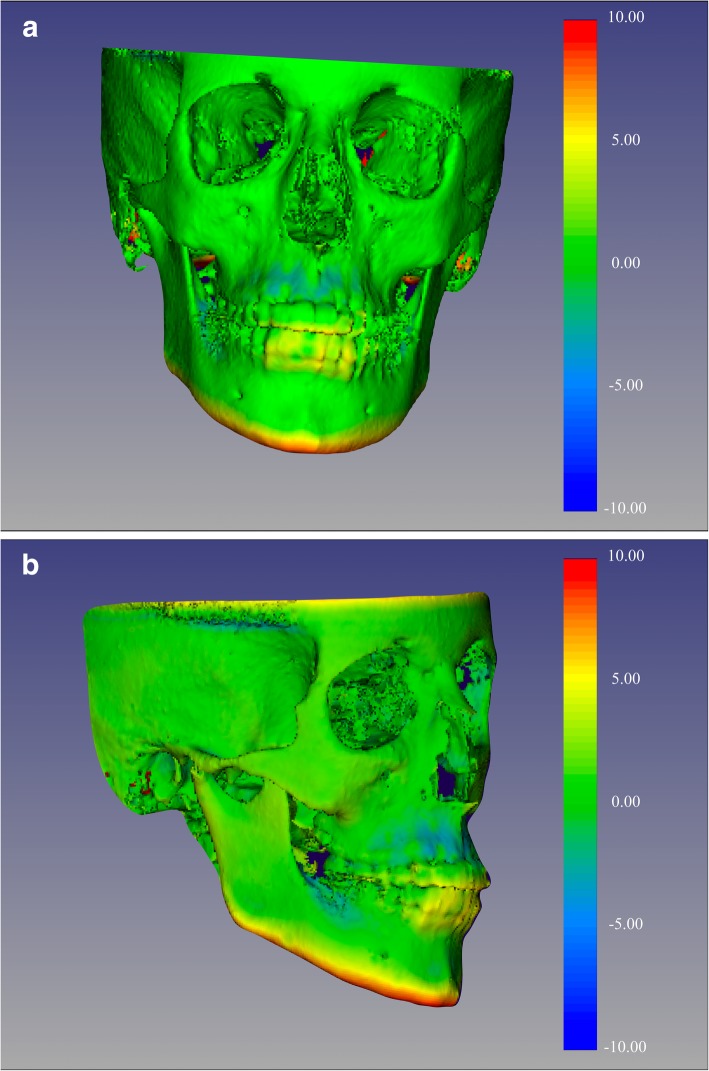
Fig. 9.
Color-coded maps with Dolphin method for visualization purposes only, not quantitative assessment. Frontal (Fig. 9a) and 45 (Fig. 9b) degrees views of the 3D color-coded maps showing the change in millimetres. As observed, no head orientation procedure has been performed, as Dolphin software does not have the tool

