
Figure 6.
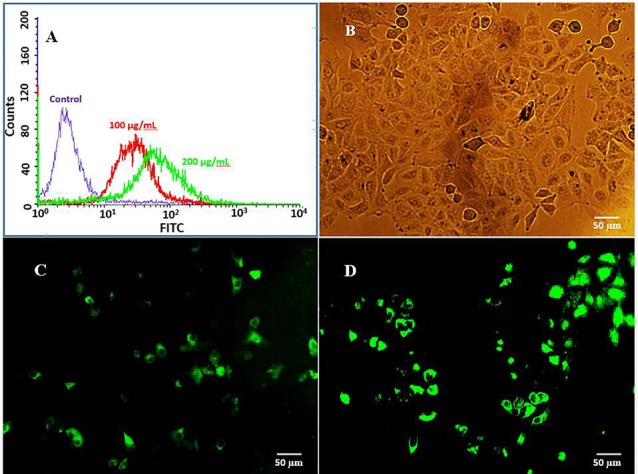
Cellular uptake of FITC-labeled EU-RL NPs analyzed by flow cytometry (A). Notes: A549 cells were treated with 100 and 200 (µg/mL) of FITC/EU-RL NPs for 2 h, and fluorescence intensity was measured by flow cytometry. Fluorescence microscopy analysis of cellular uptake of FITC/EU-RL NPs in A549 cells. Notes: Untreated control A549 cells (B), A549 cells were treated for 1h (C), and 2h (D) with 100 μg/mL of FITC/EU-RL NPs. Green fluorescence: FITC/EU-RL NPs.