. 2020 Jan 3;34(1):57–63. doi: 10.21873/invivo.11745

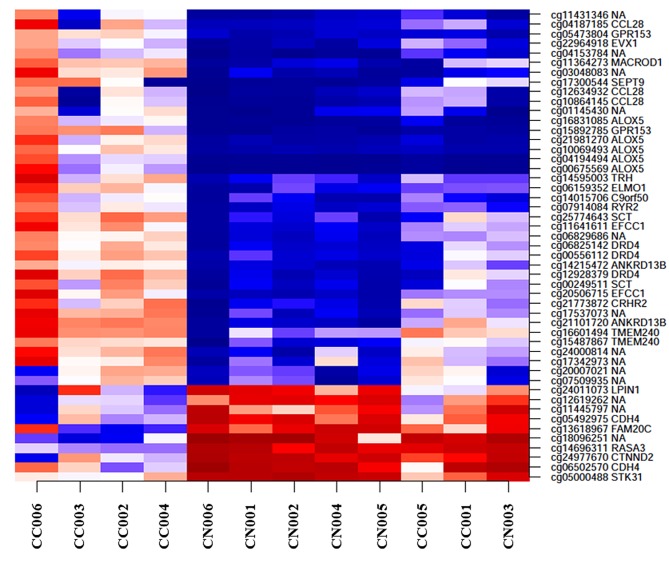
Figure 2. Heat map comparing the degree of methylation in CACRC and background non-tumorous mucosa. Our case numbers are presented as CC001 to CC006 in CACRC patients and as CN001 to CN006 in counterpart colonic non-tumorous mucosa. The horizontal axis shows each sample number and the vertical axis shows the location of methylation and the corresponding gene. Clustering of genes was performed for different levels of methylation by ANOVA analysis. The higher the intensity of red, the higher the methylation, whereas the higher the intensity of the blue colour, the lower the methylation. The left 4 CACRCs (CC006, CC003, CC002 and CC004) clearly show different methylation patterns from non-tumorous mucosa. The CC001 and CC005 on the right also show different methylation patterns. NA: Not applicable.

Figure 2