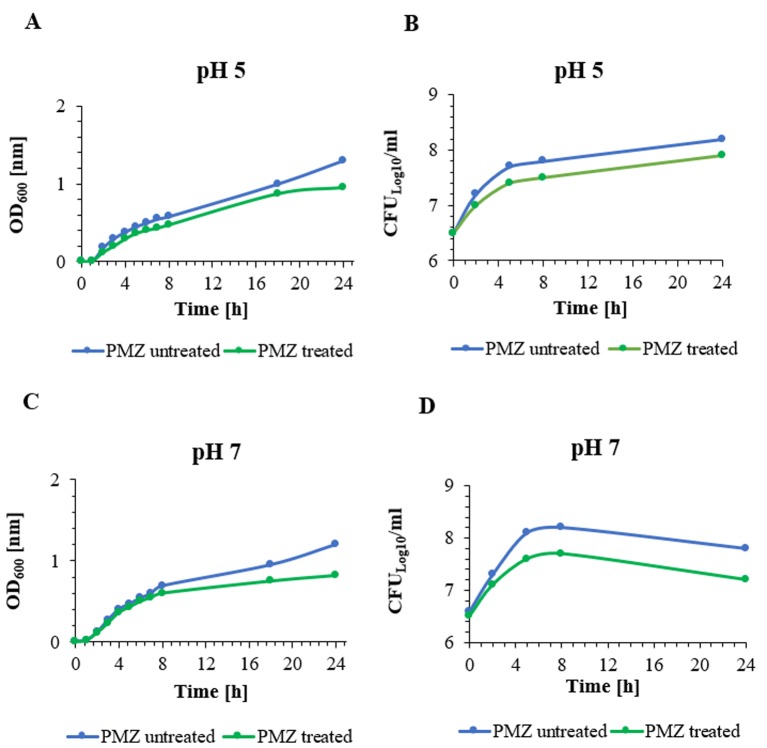
Figure 1. The growth curves of E. coli K-12 AG100 strain were determined at pH 5 (A, B) and pH 7 (C, D) in LB broth in the presence and absence of 25 μg/ml of PMZ. Graphs A and C show the growth curves by measuring the optical density (OD600) at pH 5 and pH 7, respectively. Graphs B and D show the growth curves by counting the CFUs at pH 5 and pH 7, respectively. The growth of PMZ treated bacterial culture was slower at pH 5 compared to pH 7. The growth of bacterial culture was more rapid at pH 7, moreover after 8 h of culturing the declination phase of the bacterial culture could be detected at pH 7 (Graph D).


